Geographic Information Systems (GIS)
Author: Arnold Nagy, Central European University (Budapest, Hungary)
INTRODUCTION
“GIS is an integrated system of computer hardware, software, and trained personnel linking topographic, demographic, utility, facility, image and other resource data that is geographically referenced.” NASA
Geographic Information Systems (GIS) represent a combination of hardware, software and data, which allows for the capture, management, analysis, and display of geospatial (geographically referenced) information. In a GIS, layers of spatially explicit data are linked to tabular (attribute) data in relational databases, allowing the user to analyze and visualize patterns and trends.
Technology notes for the water management practitioner:
- GIS provides both critical input and an invaluable analysis framework for water resources management. From scientists, to managers, planners and policy makers, the vast majority of practitioners are involved, in some form or another, with the manipulation and/or analysis of geographically referenced data.
- GIS provides a comprehensive set of tools and methods to aid practitioners in watershed management, stormwater/wastewater management, surface water management and groundwater management, as well as integrative approaches (e.g. water quality, water utility management).
- A large variety of GIS software platforms exist, ranging from proprietary to open-source programs, from web-based to desktop applications, each with their respective strengths and weaknesses.
- Water management practitioners have a choice in using dedicated GIS tools and packages, or configuring/customizing standard GIS tools to achieve their objectives.
- Web-based GIS applications attract an increasing number of users for their usability and accessibility. Desktop and (LAN, WAN) server-based applications for an important segment of the GIS market due to their power and versatility, but ever-increasing computational capabilities in the cloud are closing the gap.
GIS ARCHITECTURE
From an information management standpoint, the architecture (structure) of a GIS can be split into three main components, each contributing to its core functionality:
- A user-interface / client: allows the user to interact and use GIS tools through a graphical user interface (GUI).
- An application engine / server: the collection of tools available for the user to manipulate and analyze GIS data
- A database: the data stored as files or web services and the associated database management software
This three-tier architecture of GIS systems allows for a number of operational implementations, differentiated by the location of the main components and services (Longley et al., 2010):
- Desktop: all software components are installed and run from a single machine (usually a desktop computer).
- Client-server: functionality is split between the client (computer running the user-interface), with some functionality/services and the data typically being hosted on a remote computer (server).
- Centralized desktop: a GIS desktop application with limited processing capability is installed on the client side; tools and data are hosted on a server; common with departmental implementations.
- Centralized server: enterprise GIS and web-based GIS belong to this category; simple interfaces (e.g. web browser) allow control of the user interface (typically hosted on a remote server), while tools and databases are hosted on dedicated servers, often linked within large networks.
Developments in GIS infrastructure have brought about a diversification of software components tailored for specific configurations. Today, “traditional” desktop GIS still serve an important segment of the GIS user base, while centralized desktop GIS remain common in enterprise implementations. Web-based GIS is registering rapid growth, due to the unique combination of ease-of-access and opportunities for collaborative/shared work presented by cloud computing. Figure 3 shows some of the most representative GIS software packages (both commercial and open-source) within the three-tier GIS architecture.
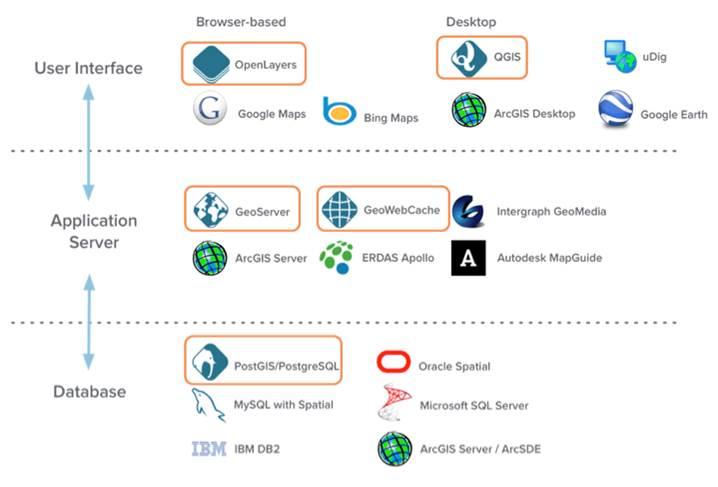
Figure 3. Software packages within the three-tier GIS architecture (Calamito, 2015).
GIS DATA
GIS data can be separated into two categories: geospatial data (spatially referenced data, representing data that is referenced to locations on Earth) and attribute data (any type of additional information linked or which can be linked to spatial data; typically organized in tabular format). Figure 1 displays an example of spatial data and associated attribute information in a GIS.
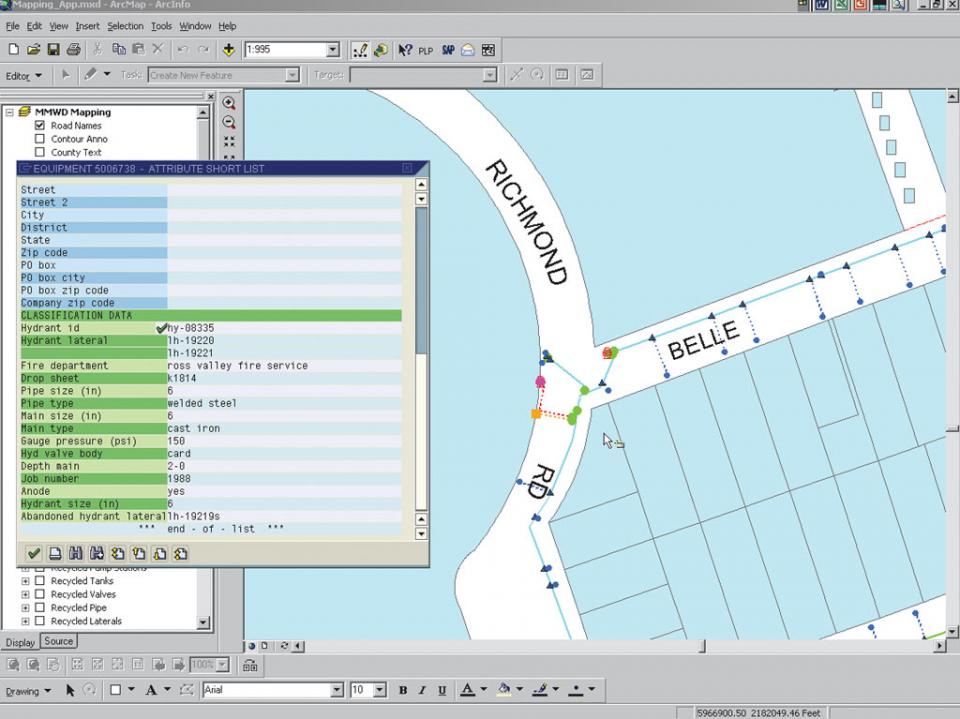
Figure 1. Spatial and additional (attribute) data in a GIS: municipal water distribution (ESRI).
Spatially referenced data can be grouped into two main types: vector and raster. These correspond to two different models (Figure 2) of representing geographical space. The core capability of GIS software applications is their ability to manipulate and analyze vector and/or raster data.
Vector data uses coordinates to represent geospatial data. Vector data can be points, lines (or arcs), or polygons. All of these are formed from basic spatial units: points are non-dimensional abstractions defined by their coordinates (x-y references to locations on Earth’s surface), lines are sets of related points, while polygons are sets of related lines. Vector data models are useful for representing linear features (e.g. rivers, water utility distribution networks), areas (e.g. watersheds), or locations (e.g. monitoring stations).
Raster models are an abstraction of the real world where spatial data is organized into a regular grid structure of rectangular cells. Surfaces are represented as a mesh of discrete units, while the location of the cells is “encoded” within the ordering of the data matrix, as opposed to the explicit location storage of vector data.
Both vector and raster data have their particular features, advantages and disadvantages:
- Vector data is the best option for representing spatial features with limited generalization (e.g. high-resolution depiction of linear features, such as rivers and streams).
- Analysis involving topology typically make use of vector data (e.g. proximity or network analysis).
- Simplified data model makes raster data ideal for quantitative analysis and modelling, especially with large datasets.
- Raster data models are well suited for continuous/discrete surface data, common with remote sensing information.
- Raster data is characterized by the generalization of spatial data; careful consideration of objectives and cell size selection are required for each analytical framework.
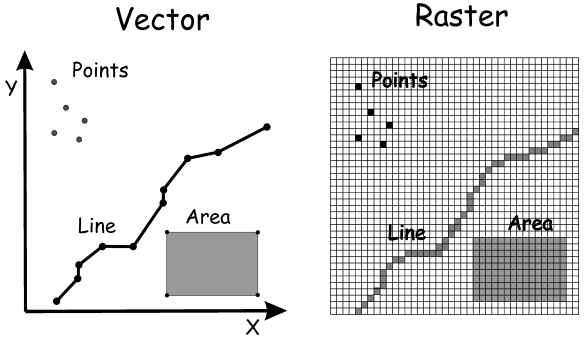
Figure 2. Vector and raster data models in GIS (Bolstad, 2005).
GIS TOOLS FOR WATER MANAGEMENT AND WATER SECURITY
GIS is an important tool for both researching and managing water resources. Its capabilities for integrating, processing, visualizing and analyzing spatial and temporal patterns make it extremely useful in supporting the daily work of water management practitioners around the world.
Some of the key applications of GIS in water resources management are:
- Data management and data visualization (e.g. water resource inventories)
- Watershed management
- Hydrological modelling
- Drought assessment and forecasting
- Flood management
- Water quality: mapping, interpolation, monitoring, modelling
- Storm water and nonpoint source pollution modelling
- Water utility routing, operation and management
- Water resource decision support systems
Given the implementation and scope of the GIS tools used in water resources management, we can categorize them as:
Generic – GIS tools and packages that provide core geospatial analysis / data modelling capabilities. A fully-fledged GIS implementation contains a wide range of data transformation, analysis and visualization tools that are useful for all scientists and practitioners working with spatial data.
Specific/specialized – tools that have been developed for particular applications in water management (e.g. hydrological modelling, watershed management, water utility routing).
Generic GIS packages typically provide the analytical platform in which additional, specialized tools can be integrated. An important and growing trend in GIS technology is increased interoperability between GIS packages in both data and tools. In practice, this allows the user of a specific GIS platform to access/process not only data generated by a different platform, but also tools which are not part of its core functionality. Both commercial and open-source GIS software packages can typically be customized with additional functionality, through high-level scripting languages and web-services.
Specific GIS tools are either developed for a particular platform (typically the case for commercial and proprietary software), or can be used cross-platform (usually the case for open-source applications). Specialized analytical GIS tools released by the largest commercial GIS suppliers belong to the first category. We can list here, for example, the ArcHydro and Groundwater tools developed by ESRI for its ArcGIS platform, or the water distribution, wastewater and stormwater applications developed by Bentley for its CAD-based platform. A growing number of free and/or open-source hydrological tools are available to water resources management practitioners. Their core GIS capabilities are typically significantly more limited than those of generic GIS platforms. For this reason, they typically borrow GIS functionality from the latter (e.g. the Water Observation and Information System - WOIS, developed around QGIS), focus on data modelling (e.g. EPA’s EPANET for water distribution piping systems), or both (e. g. the widely used Soil and Water Assessment Tool – SWAT, which can be run as executable or as an extension to ArcGIS or QGIS).
Irrespective of particular projects of interest, working with geospatial information and GIS requires some level of familiarity with one or several generic GIS platforms. Starting with the well known ArcGIS platform developed by ESRI, a number of other established GIS software packages exist, both free and commercial, with their respective strength and weaknesses. Following is a table listing 20 of the most popular GIS platforms in the world today (both commercial and open-source/free), with a summary of their respective advantages and disadvantages, according to a September 2015 review of the “GIS Software Landscape” published on gisgeographer.com.
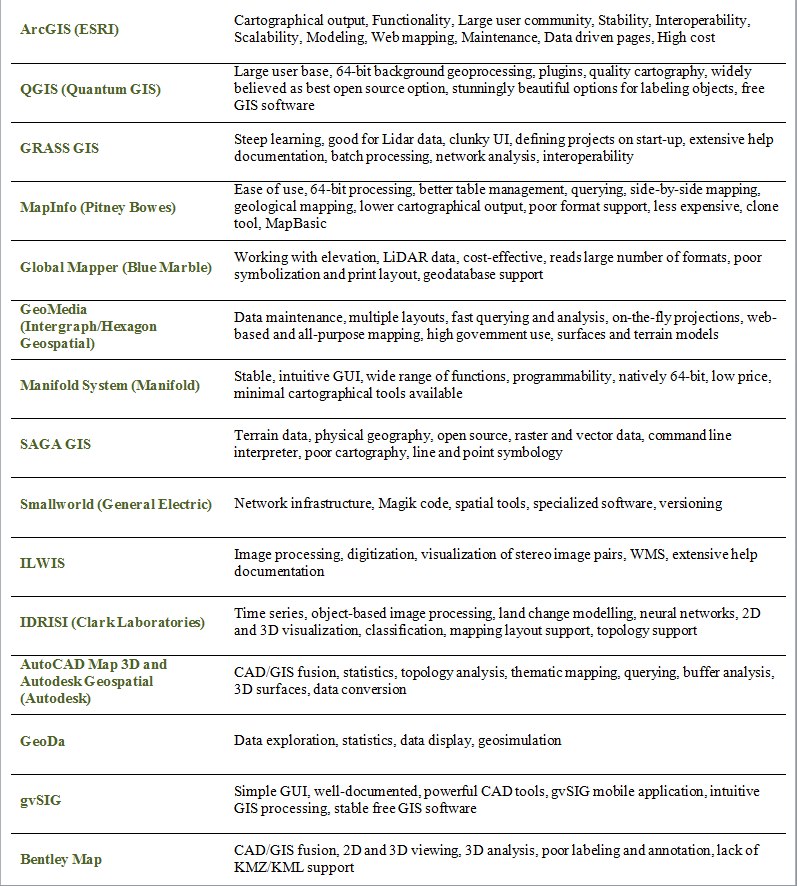
Table 1. Some key features of twenty of the most common GIS software platforms available today (Source: http://gisgeography.com/mapping-out-gis-software-landscape/)
REFERENCES
Bolstad, P. 2005. GIS Fundamentals: A first text on Geographic Information Systems, Second Edition. White Bear Lake, MN: Eider Press
Calamito, A. 2015. Considering a Hybrid Proprietary/Open Source Architecture. Available online at: http://boundlessgeo.com/2015/04/considering-hybrid-proprietaryopen-source-architecture/ (Accessed September 29th, 2015).
ESRI, 2004. Marin Municipal Water District Updates Infrastructure With GIS. Available online at: http://www.esri.com/news/arcnews/fall04articles/marin-municipal.html (Accessed September 29th, 2015).
Longley PA, Goodchild MF, Maguire DJ, Rhind DW. 2010. Geographic information systems and science. 3rd ed. Hoboken, NJ: Wiley; 2010.