- Home
- Case Studies
- GIS Based Tool for the Landscape Retention Planning
GIS Based Tool for the Landscape Retention Planning
Author(s)
Organization(s)
Map
Attachments

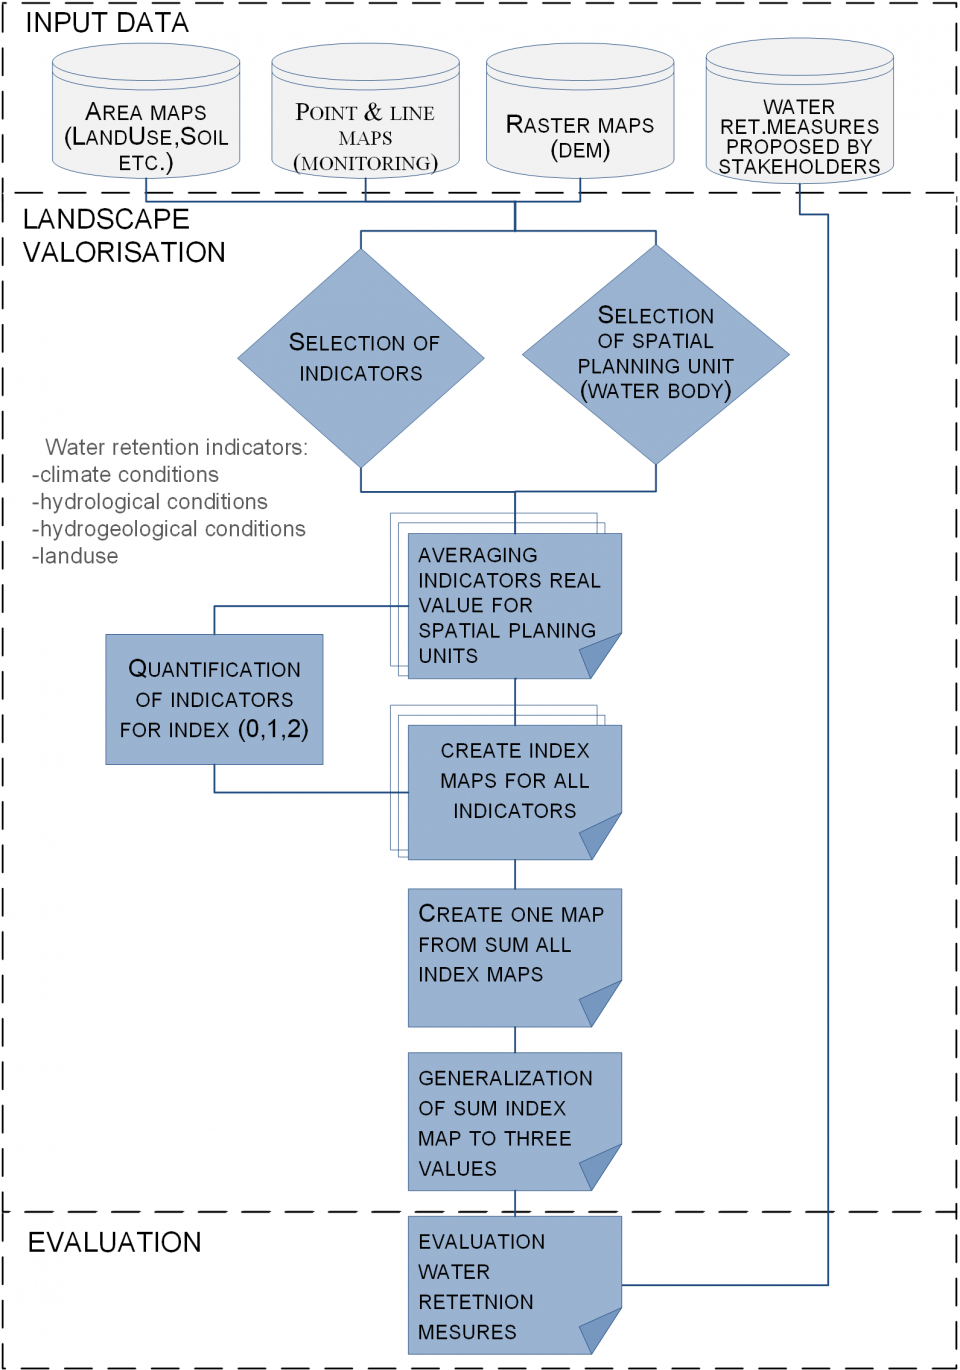
Figure 1. Work flow for valorization of needs for water retention demand

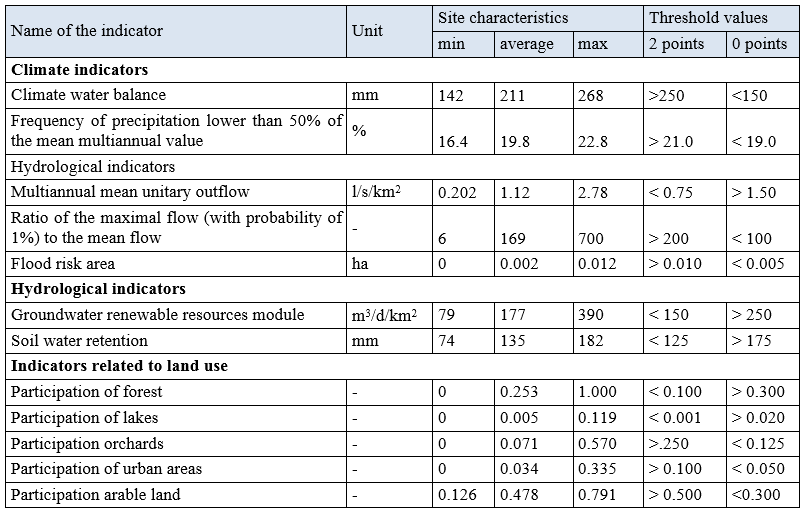
Table 1. Characteristics used in the evaluation process and their threshold values (source: Mioduszewski at el. 2015)

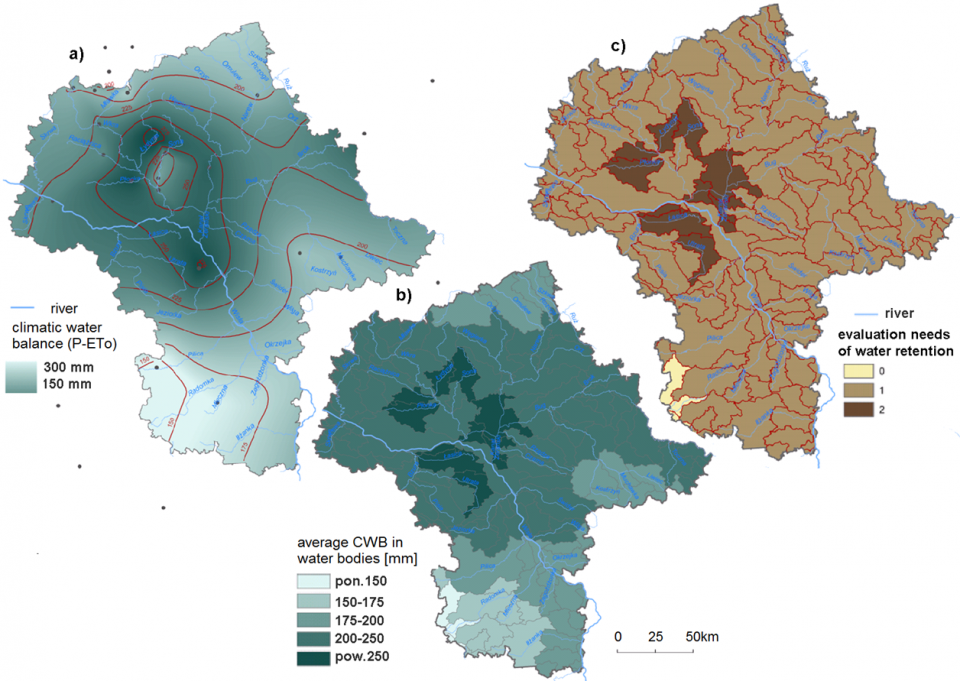
Figure 2. Example of indexing process for climatic water balance: a) isolines of climatic water balance (CWB), b) average CWB in water bodies, c) evaluation of water retention needs for water bodies. Source: Mioduszewski at el. 2015

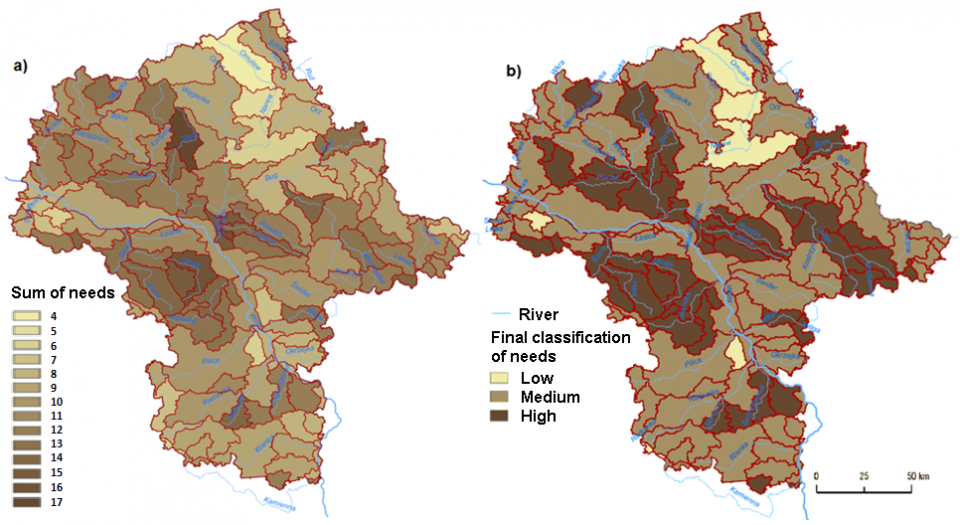
Figure 3. General evaluation of water retention needs in integrated water bodies; a) the results of evaluation (classes 1-17) of the Unified Water Body, b) the priority of small water retention measures. Source: Mioduszewski at el. 2015
Technology Description
For landscape valorization aimed on water retention needs ArcGIS Desktop Geographic Information System made by ESRI was used. Thematic maps (land use, hydrological and meteorological monitoring, soil water capacity and ground water resources) formed an input to the system. Geostatistical analyses were done as illustrated in Figure 1 and as a result three classes representing needs for water retention demand were identified. Finally the water retention measures proposed by stakeholders were evaluated.
Geographical Scope Description
The analysis (case study) was done in Poland on the area of the mazowieckie voivodeship (35,579 km2).
Problem Description / Relevance to Water Security
The proposed analysis was relevant to mitigation of droughts and floods. The other aim was to preserve the biodiversity of habitats that are strongly related to water resources, including habitats and species of a great natural value. Measures categorised as small retention aims to cause a slowdown of surface water runoff, rainwater outflow, and subsurface flow. While planning for undertaking such measures, measures aiming at retention of water within the catchment by increasing soil retention, use of aquatic ecosystems, old meanders and ponds should be prioritised.
While developing a project, it is recommended to use natural conditions and features of the environment in a way that limits any potential negative impact. The use of natural conditions and features creates the best chances for success, and keeps costs to a minimum. As efficiency of this type of measures is strongly depended on numbers (many) and location (possibilities and needs), analytical tool for the feasibility study is much needed.
ICT Application / Outcome
The valorisation procedure was done (Figure 1) in following steps:
- Selection of Spatial Planning Unit (SPU) – in this case water bodies (as recommended by EU Water Framework Directive) were used.
- Selection of available indices characterising disposable water resources and retention capacity of SPU.
- Spatial analysis based on:
- Calculation of mean values of the factor for each SPU e.g. share of forests, mean unitary outflow;
- Valorisation of the factors into three indices (0; 1; 2) where 2 means that implementation of measures for an increase of retention capacity in a SPU is needed, 1 means that increase of retention capacity in a SPU would be beneficial, and 0 means that there is no need to increase the retention capacity;
- Creation of the aggregation map by summary of the indices for SPUs that spatially overlap each other;
- Redistribution of the values on three needs of retention demand:
- High – development of small retention is very desirable;
- Medium – development of small retention is beneficiary;
- Low – development of small retention is not needed.
For example, the indicators listed in Table 1 were defined for the Mazovian Region in Poland, but similar calculations can be done for other regions.
The aim of this analysis is to increase the flexibility of the spatial planning, defined by the area, not the precise location, and evaluate the investments in the light of environmental needs.
In the first stage of the analysis, a water body was selected as a Spatial Planning Unit (SPU).
In the second stage, considering limitations in data availability, four groups of factors characterising disposable water resources were identified:
Climatic (meteorology and hydrology) indicators:
- Climatic water balance (difference between precipitation (P) and reference evaporation (ETo));
- Frequency of precipitation lower than 50% of the mean multiannual value.
Hydrological conditions:
- Multiannual mean unitary outflow;
- Ratio of the maximal flow (with probability of 1%) to the mean flow;
- Flood risk area.
Hydrogeological indicators:
- Groundwater renewable resources module for first aquifer;
- Soil water retention (for 1m layer depth and 2-4.2 pF).
Land use indicators from Corin Land Cover (participation in % in SPU):
- Forests;
- Lakes and artificial water reservoirs;
- Urbanised areas;
- Orchards and vegetable cultivation;
- Arable lands.
A map of the climatic indicators has been developed based on the interpolation of meteorological data that was obtained from the representative measuring sites (Figure 2a). A map of the hydrologic indicators has been generated by connecting the multiannual statistical data on water flow from water gauges with the respective catchments. A map of the soil retention has been developed by the Polish Institute of Soil Science and Plant Cultivation. Finally, a map of the module of renewable groundwater resources has been obtained from Polish Geological Institute.
In the third stage, the mean value of all indicators for each water body was calculated based on the spatial analysis. The exemplary results of the analysis have been presented in Figure 11a and Figure 11b. In the next step, values of the indicators have been changed into indices: {0; 1; 2} (Figure 2c). The process demanded definition of two threshold values for each indicator. The threshold values defined the degree of needs of the area for development of small retention. The threshold values reflecting respective classes of needs and the scope of variation of the analysed indicators have been given in Table 4. These values should be evaluated individually, depending on the characteristics of the analysed area. In the next step, a summary evaluation of the needs of each water body was done. The evaluation was based on all analysed indicators. Based on the total value of all points (maximum number that was possible to obtain was 17), all Unified Water Bodies (UWB) were grouped into three categories (Figure 3):
- High need of small retention – water bodies with a sum of all points equal or higher than 12 points;
- Medium need of small retention – water bodies with a sum of all points between 7 and 11 points;
- No needs of small retention – water bodies with s sum of all points below 7.
Applicability / Transferability
This valorization process can be used in any geographical areas depending on data availability and the only need is to develop region relevant quantification of indicators and threshold values.
Final Thoughts / Advantages & Disadvantages
The technology aims on relation between the landscape (catchment) use and the needs for small water retention measures. It is an additional area of water management, which is not covered by the traditional planning of big controlling structures. It is a cheap solution for the sort of the feasibility study, however it is a data driven tool.
References
Pusłowska-Tyszewska D., Kardel I., Tyszewski S., Okruszko T. and Chormański J. 2008. Substantial basis of the small water retention program in the Masovian Voivoidship (in Polish). Infrastruktura i ekologia terenów wiejskich. Kraków p. 71–84.
Mioduszewski W., Okruszko T. 2015. Combining drought mitigation, flood protection, and biodiversity conservation. GUIDELINES. Manuscript of GWP.


