- Home
- Case Studies
- Use of Remote Sensing and GIS in Water Resources Management: North Western Sahara Aquifer System (NWSAS)
Use of Remote Sensing and GIS in Water Resources Management: North Western Sahara Aquifer System (NWSAS)
Author(s)
Organization(s)
Map
Attachments

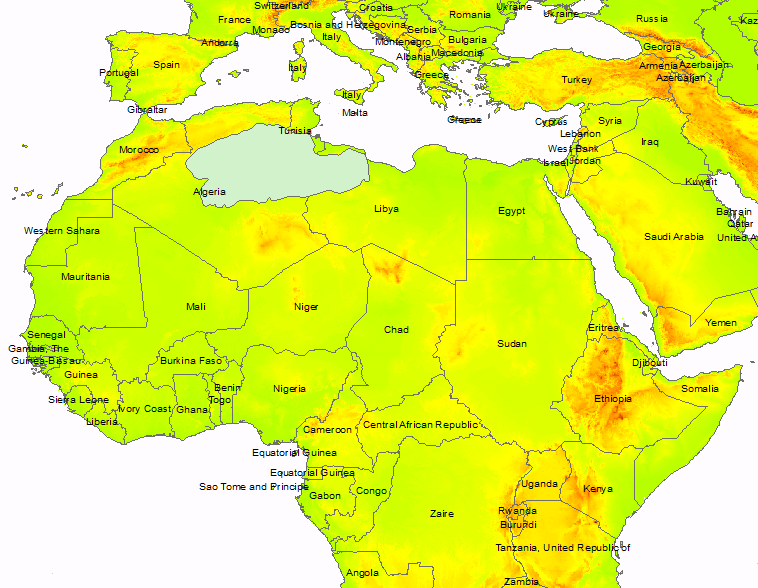
Figure 1. Geographic location of the study area (NWSAS)

Figure 2. Increase of the number of drilling points between 1950-2012

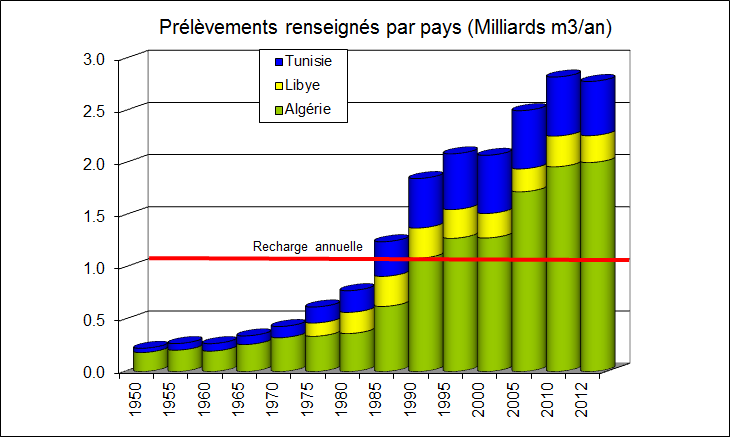
Figure 3. Chart of water withdrawal over the NWSAS from 1950-2012, the red line represents the annual recharge

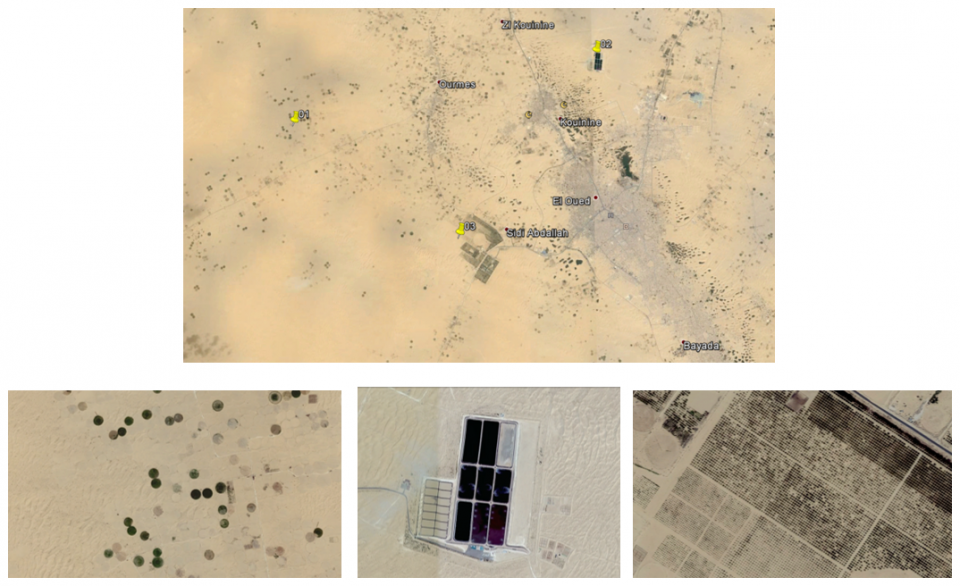
Figure 4. Different types of Agriculture in the region (Imagery Source: Google Earth 29/7/2014)

Figure 5. Expansion of agricultural activities between 2007 and 2014 (Source: Google Earth 31/08/2007 and 29/07/2014)

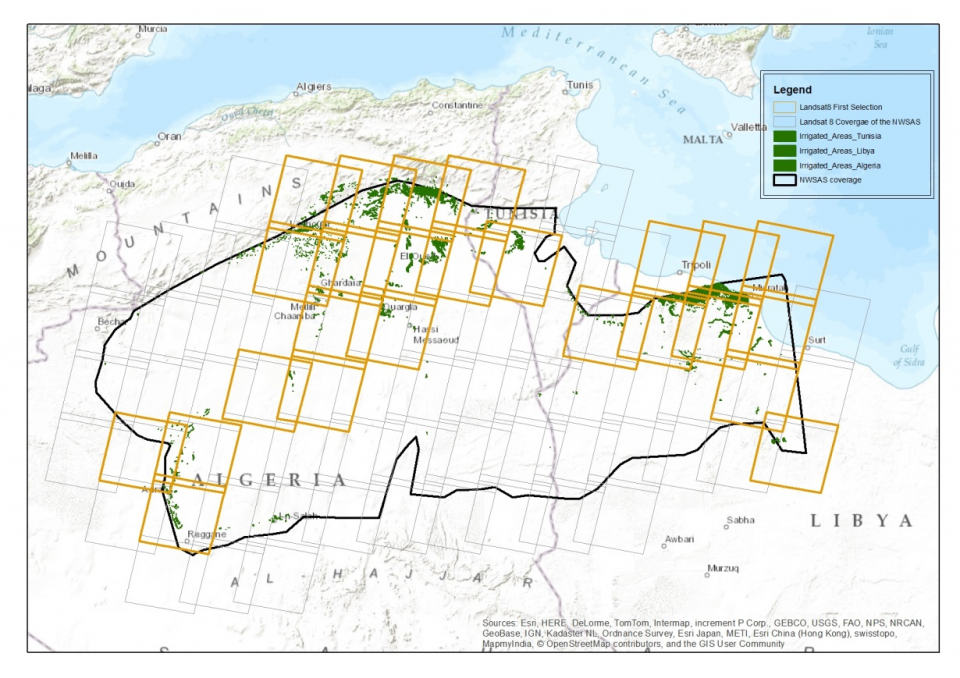
Figure 6. Landsat cover of the NWSAS region, where brown polygons indicate the region with a significant vegetation cover (priority in processing)
Technology Description
Since most water resources in this region are for irrigation use and field data collection for an area of 1 million sq km is very costly, use of indirect methods is highly recommended. We used remote sensing techniques forregional monitoring of irrigation and water uptake in arid/semi-arid areas:
- To map the irrigated areas;
- To study the dynamics of changes in vegetation cover from 2004-2014;
- To estimate the water volume used for irrigation.
Geographical Scope Description
The North-Western Sahara Aquifer System (NWSAS) covers three countries (Algeria, Libya and Tunisia) and is the main resource for irrigated agriculture in arid zones. It extends over a total area of more than one million km²: 700,000 km² in Algeria, 80,000 km² in Tunisia and 250,000 km² in Libya. See Figure 1.
Being mostly of a desert type, this region receives very little rainfall and the annual recharge of the aquifer system is only about one billion m3 per year. It is a natural resource that is not quite renewable.
Problem Description / Relevance to Water Security
The North-Western Sahara Aquifer System, which stretches over an area of more than one million square kilometers, is shared by Algeria, Tunisia and Libya. Due to the structural configuration and climate type of the region, the recharge of the NWSAS is very limited. These aquifer systems represent geological reserves whose natural outlets (springs and foggaras) led to the development of oases where people lived, for centuries ago, in perfect harmony with the Saharan ecosystem.
Agriculture represents the primary source of livelihoods for a large part of the African population. Agriculture in Africa is diverse and ranges from small subsistence to large commercial farming systems.
About 90% of water withdrawals in this region are consecrated to irrigation. Intensified water abstraction has led to serious problems: regular lowering of the water level, increased cost of pumping, reduction in artesianism, drying up of natural outlets, poor water quality due to salinization, etc.
An effective management of agriculture in Africa requires deep knowledge as science plays a key role in understanding its dynamics. Remote sensing techniques provide recurrent information on vegetation cover and water resources management in various spatial and temporal resolutions and represent therefore a valuable source of data and information.
Groundwater is vital to most nations and worldwide. For instance, irrigated agriculture is the largest user of ground water. Groundwater resource development has had great social and economic benefits by low-cost, drought-reliable and high quality water supplies for urban areas, rural populations and crop irrigation (90% of rural water-supply in Sub-Saharan Africa). The economies of these countries highly depend on groundwater resources.
Groundwater withdrawals in the three concerned countries have remarkably increased over the last 50 years. Agriculture accounts for about 90% of the total withdrawals and projections indicate that a further increase of water withdrawals in the three countries of focus is more likely to happen. For instance, water withdrawal (extracted from more than 16,000 water points) increased from 0.6 billion m3 in 1950 to about to 2.8 billion m3 in 2012, compared to a recharge level of about 1 billion m3/year in total. Based on hydrogeological studies coordinated by UNESCO then OSS, a consultation mechanism for the North-Western Sahara Aquifer System (NWSAS) was set up in 2002. In June 2007, Algeria, Libya and Tunisia decided to set up its permanent secretariat at OSS premises. The activities of this mechanism are fully supported by the three member countries and can be considered similar to a Basin authority.
Due to a rapid increase of groundwater use for irrigated agriculture in arid zones, Algeria, Libya and Tunisia face the challenge to set-up an agriculture development action plan that takes into account the sustainability of this unique water resource (The North Western Sahara Aquifer System (NWSAS). The actual increase of water extraction for irrigation will have serious consequences on the integrity of these non-renewable groundwater reservoirs in terms of quantity, accessibility and quality. In order to provide water management institutions with efficient tools to manage this resource, OSS, together with other international partners, has developed a set of methodologies based on a hydrogeological model and earth observation (EO) based services.
The North-Western Sahara basin has registered a significant increase in water abstractions, going from 300 million m3/year in 1950 to almost 2.8 billion m3/year in 2012. See Figure 2 and Figure 3.
Water points are not equipped with meters, so data is mainly gathered using survey collection techniques based on information provided by water users and water volume approximations (generally every 5 to 10 years, as the survey is very costly).
Despite the accumulation of considerable non-renewable water resources estimated at 30 000 billion m3, water withdrawal for agricultural use resulted in an overall situation on the basin characterized by:
- A drop in artesianism;
- A decrease in groundwater levels and an increase in pumping costs;
- Water and soil salinisation.
Moreover, an increased exploitation of the NWSAS for the coming few years is more likely to happen due to the following reasons:
- Demographic growth: the population is expected to double, increasing from 4 million to 8 million by 2030;
- Intensive transfer of water to supply periphery zones of the basin which are highly vulnerable and sensitive to climate change. Thus, added to the growing demand of water caused by population growth, the basin resources are also exploited to feed the other populations living on the peripheries of the basin.
The common challenge nowadays for the three countries concerned is to ensure a sufficient water abstraction for the development of the region without inducing negative impacts on the resource.
Agriculture and vegetation cover on this aquifer are represented generally by small patches (small areas compared to the overall area of 1 million km2), or a concentrated agriculture in the oases. See Figure 4 and Figure 5.
ICT Application / Outcome
As water resources are mainly related to agriculture in the area of interest, a first vegetation mapping was realized based on MODIS time-series NDVI covering the NWSAS area over the last 10 years in order to establish a first vegetation areas inventory, to better understand the spatial distribution and year-to-year variability in irrigated areas.
Results:
- First inventory of vegetation over the region. In addition, vegetation phenology indicates the presence of permanent vegetation (e.g. palms) or temporal vegetation (e.g. irrigated parcels of potatoes) which allows the mapping of vegetation patterns and evolution in the NWSAS area of interest;
- A better quantification of the total area of irrigated perimeters.
Land use / land cover (LU/LC) mapping over the 3 pilot sites at 1/25,000 scale, namely Tougourt (Algeria), Tripoli (Libya), and Medenine (Tunisia). The land use/land cover maps are realized based upon high spatial resolution earth observation satellite imagery and field data collection.
The elaboration of these maps was done by conducting in-field surveys with farmers and institutions in charge of water resources in the concerned region on irrigation rates according to seasons, climate and soil, which facilitated the estimation of water withdrawals, and hence helps to ensure a better understanding and management of the NWSAS water resources.
Results:
- LULC maps at a finer scales of the pilot sites were realized, which helps to enhance a better understanding of the oases and arid agro-ecosystems functionality;
- Comparison of the water use/crop water requirements;
- Better understanding of irrigation scheme: how and when the farmer irrigates, how much water is he using for each crop.
Remote sensing can be used in order to estimate water withdrawal. For that, the state-of-the-art water balance models available in scientific literature were analysed and the pros and cons of each model as well as the relevance of its application for our region of interest were studied in depth. The specific nature of agriculture, the crops’ water requirements, the irrigation techniques used and the existing data (accuracy, validity and completeness) were taken into consideration.
Results:
- Study the best suitable approach for our area;
- Knowing that the same experience was successfully done in other regions having the same constraints (climate, type of agriculture, etc.) make us believe that it can be done if we have enough funds.
Operational Recommendations for a Sustainable Management of the SASS Water Resources: this was the final outcome of the SASS project (3rd phase, see more at: http://sass.oss-online.org/en/sass-project) concerning the utilization, management, and measurement of water extracted for agricultural purposes, notably in the zones where the water, the soil and/or the ecosystem are most vulnerable.
Results:
- The “socioeconomic and environmental survey” component of the project aims to analyze and understand the socioeconomic dimension of water extracted for agricultural purposes (irrigation) and the behavior of farmers in using the SASS water resources. Hydro-economic model based on the surveys conducted (300 farmers for the first cultivation campaign and 1500 farmers for the second cultivation campaign)
- The “demonstration pilots” component: aims to identify and introduce efficient irrigation techniques to be disseminated at a local, national and regional level. Six operational demonstration pilots addressing the problems of unsustainable irrigation water management (irrigation water valorization, geothermal water valorization in irrigation, irrigated lands affected by salinization and hydromorphy, rationalization and desalinization of brackish water, etc.
Applicability / Transferability
We have applied the approach in our region of interest, and the results were satisfactory. We believe that it’s important to duplicate the use-case in other transboundary aquifers in Africa.
Nowadays, there is a growing need to set up new approaches to promote a sustainable management of the NWSAS non-renewable water resources. Through the exchange of information and the establishment of concerted actions, the SASS/AGRICAB projects can in fact serve as a model for regional cooperation as it represents a successful example of South-South and North-South cooperation in line with OSS objectives and missions: studying and managing non-renewable water resources with a view to sustainability.
The NSWAS is composed of non-renewable groundwater reservoirs. To enhance a sustainable water management, the focus must be on irrigated agriculture: mapping the irrigated areas over the NSWAS, study the irrigation techniques used, compare water requirements among different types of crops, etc. Hence, we can deduce that groundwater is vital for irrigated agriculture on the NWSAS.
The use of remote sensing techniques and data can help to provide our partners with tools and techniques allowing them to better identify the uses, land cover, land degradation and the pressures exerted not only by the population but also by the overexploitation of water resources, by organizing the regional trainings workshop, survey on EO data needs and making available the results of the use cases developed.
The estimation of water withdrawal can be calibrated based on the withdrawal points’ database, and then applied in a continuous way to control water withdrawal and to enunciate the non-authorized ones. This could lead to a better management of the NWSAS water resources.
Final Thoughts / Advantages & Disadvantages
- Spatial resolution of the data: 250 m of NDVI from MODIS was not well suitable for our area of interest. When we overlaid the vegetation map extracted from Mod13Q1 data on Google Earth, we concluded that the results were not well representative of the area. Study the use of other indices, or NDVI from finer spatial resolution data.
- Temporal resolution of the data: Landsat 8 at 30m of spatial resolution and 16 days of temporal resolution is more suitable for the energy balance at the field level since it is free of cost data, and contains the thermal bands which are used to calculate the temperature. A scene of Landsat 8 covers around 180 km x 180 km and is around 1 Gb, in raw format, which may require more processing time and disk space, since our area is around 1 million sq km, and for energy balance models calibration, a minimum of 10 to 15 cloud free scenes are required.
- The processing of the whole archive will take a lot of time, and we do not currently have funds to cover that.. With more time and funds, human resources and skills, and ground truth and calibration, we can prove that this approach can provide an accurate estimation of water withdrawal over the region, and helps to identify the illicit water points (people are pumping water in an extensive way, and they are not even authorized).
Additional Information / Acknowledgements
Excerpts from this case study have been published in the AGRICAB technical report and reproduced here with permission of the author.
The tasks mentioned in this case study were financed by the AGRICAB project, an EC FP7 Project. The author and OSS would like to thank their partners VITO and ITC.

