- Home
- Case Studies
- Using ICTs to Investigate Agricultural-Induced Eutrophication in Freshwater Reservoirs: A Case Study of the Tsimlyansk Reservoir (Russia)
Using ICTs to Investigate Agricultural-Induced Eutrophication in Freshwater Reservoirs: A Case Study of the Tsimlyansk Reservoir (Russia)
Author(s)
Organization(s)
Map
Attachments
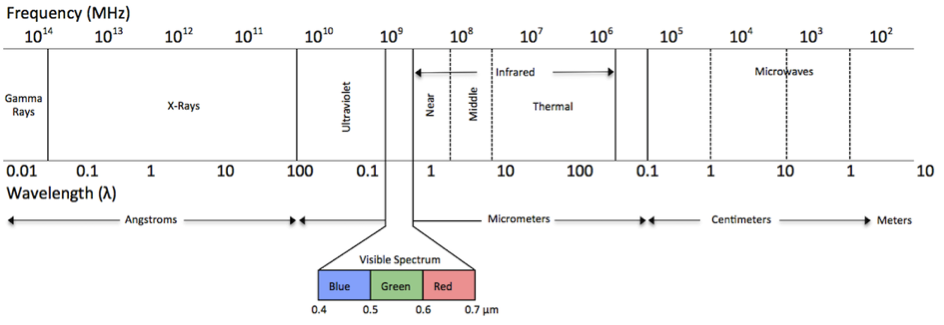
Figure 1. Electromagnetic spectrum. (Created by author based on Chuvieco and Huete 2010).
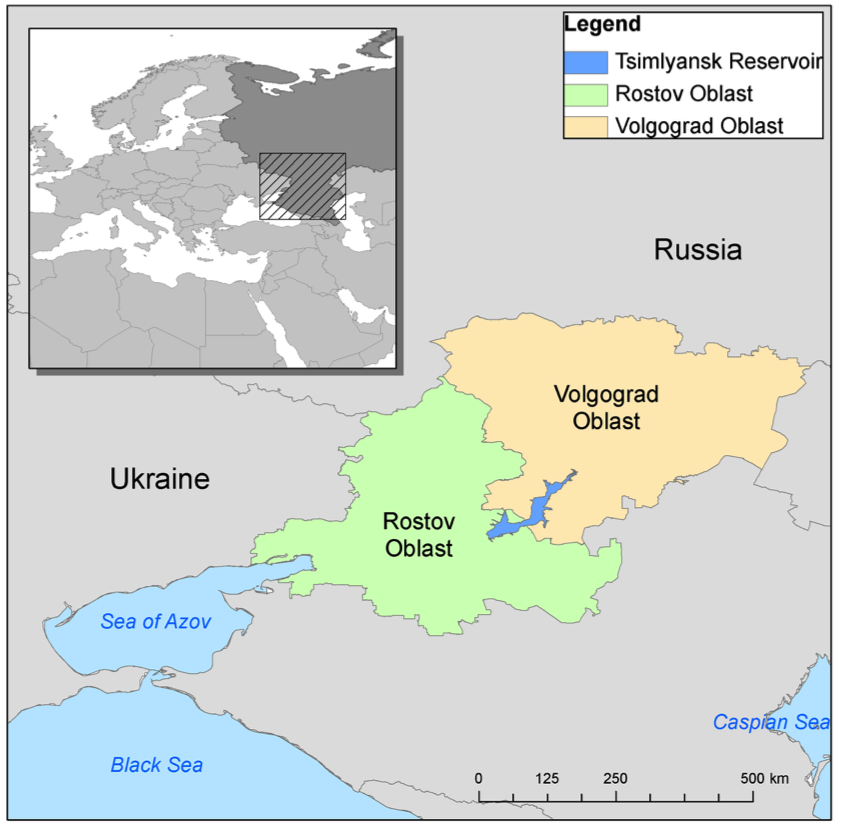
Figure 2. Map of the Tsimlyansk Reservoir in Southern Russia. (Map created by author).
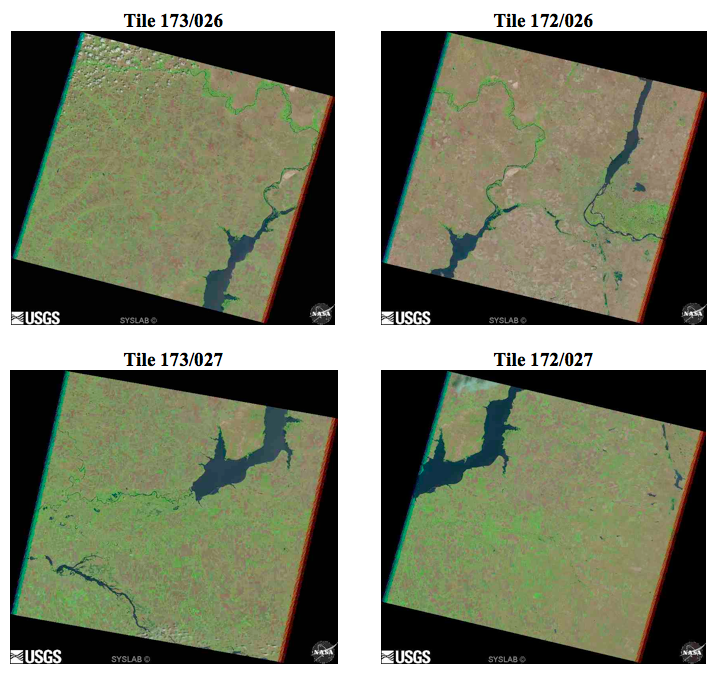
Figure 3. Four Landsat tiles selected for land use classification. (USGS 2014)
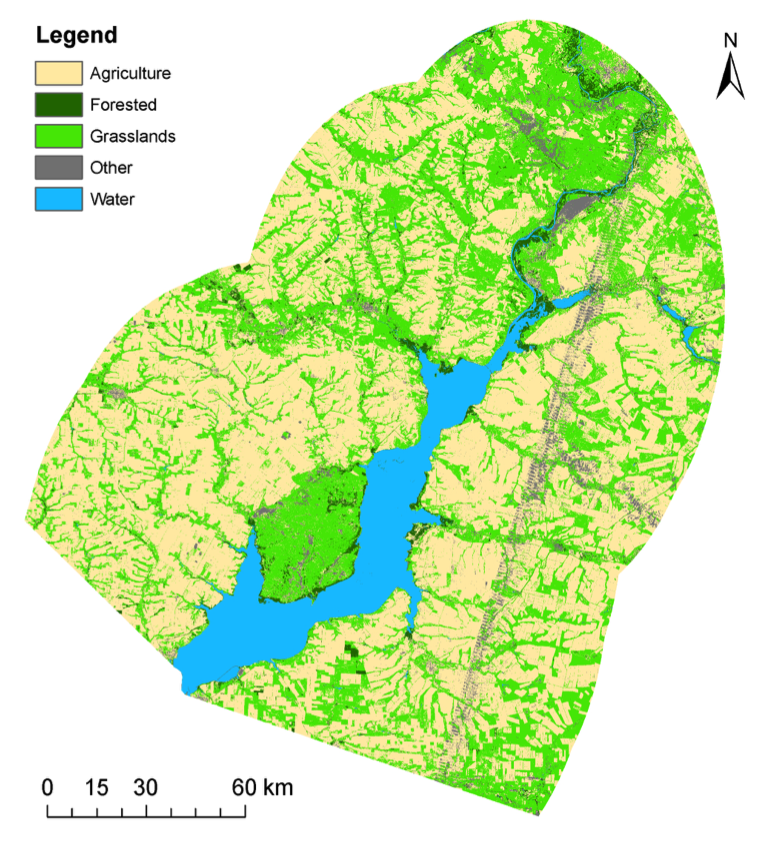
Figure 4. Land use thematic map, the result of the supervised classification, as viewed in ArcMap. (Map created by author).
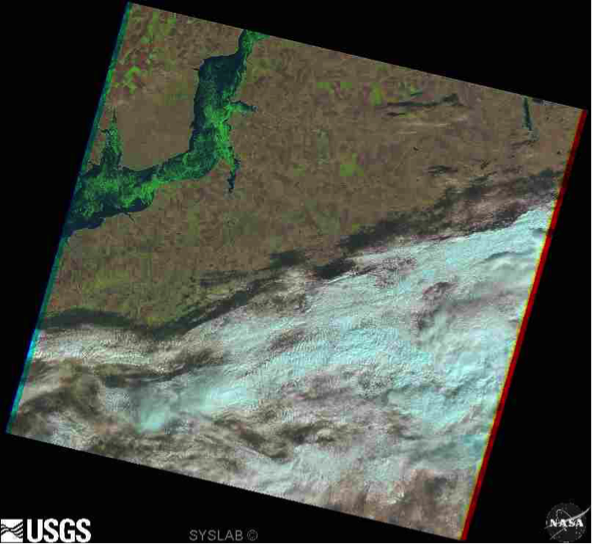
Figure 5. Identification of algal bloom within the reservoir. (USGS 2014)
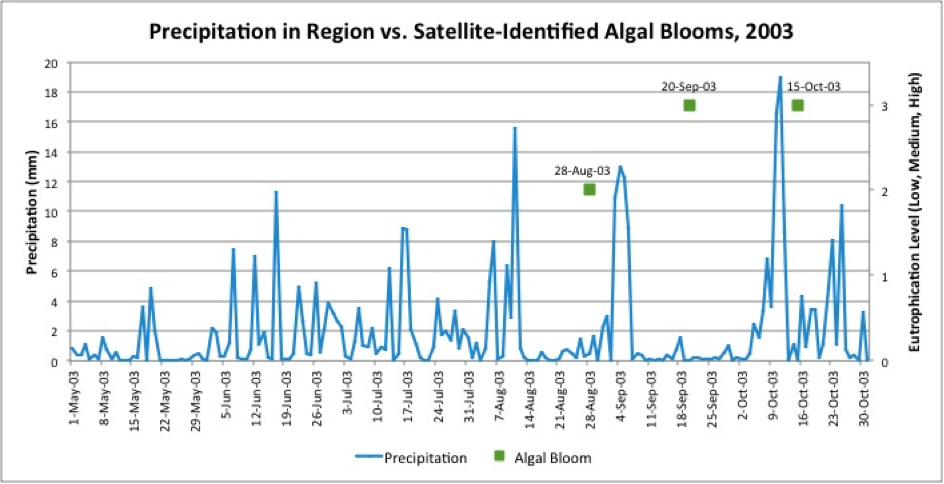
Figure 6. Precipitation vs. algal blooms for 2003. Data source: (NASA 2013a; USGS 2014)
Technology Description
Remote Sensing
Remote sensing can be defined as the acquisition of information about an object without being in direct contact with that object (Chuvieco and Huete 2010; Gibson and Power 2000; Weng 2013). In essence, it is the act of “sensing” and recording information about an object while being at a distance (e.g. a place that is “remote”) from it (Weng 2013).
The human eye can only perceive a small part of the electromagnetic spectrum, which can be defined as the range of the all of the various types of electromagnetic radiation that exist. The small portion we can perceive is called the visible spectrum and ranges from 0.4 to 0.7 micrometers (μm), as seen in Figure 1, based on Chuvieco and Huete (2010). Through remote sensing technology, we can expand the portion of the electromagnetic spectrum that we can perceive beyond this visible region. Different portions of the electromagnetic spectrum have different uses in remote sensing. For example, the near-infrared (NIR) portion is often used to study green vegetation, while the short wave infrared (SWIR) portion of the middle infrared range is often used in soil vegetation studies (Chuvieco and Huete 2010).
Objects on the Earth’s surface (as well as different types of land cover) act differently in the various parts of the electromagnetic spectrum. They have unique “spectral signatures”, which is a term that means the amount of reflectance an object gives off at different parts of the spectrum. Water, for example, has a completely different spectral signature than green vegetation because it has different levels of reflectance at various wavelengths in the spectrum (Chuvieco and Huete 2010). Because of these spectral differences, it is possible to use remote sensing to detect the type of land cover on the Earth’s surface based on the land cover’s specific spectral signature.
Remote sensing has proved to be a useful and effective technology in 1) determining and mapping land use and land cover, as noted in Kuemmerle et al. 2006, and 2) in water applications, including the assessment eutrophication as an indicator of water quality (Ritchie et al. 2003; Kitsiou and Karydis 2011; Barnes et al. 2014; Brivio et al. 2001; Farag and El-Gamal 2011). Remote sensing analysis is not constrained by space or time, unlike the use of in situ measurements or on-site ground-truthing (the act of physically going to a location to verify what is on the ground) and the number of available images is continually increasing, ever-expanding the period of time that can be studied. Additionally, it allows for consistent and reliable information across administrative and political borders, unlike many other methods of data collection. The use of satellite imagery allows for a much broader analysis of an area, both spatially and temporally (Brivio et al. 2001; Ritchie et al. 2003). This broader perspective, and the ability to continually monitor as time goes on, is a necessity for the proper management of water bodies (Ritchie et al. 2003).
Geographical Information Systems (GIS)
There are many different geographic information systems (GIS) software platforms. This case study uses: GRASS GIS, ArcGIS, and Quantum GIS, described below.
- GRASS GIS (Geographic Resources Analysis Support System) is a free open source GIS software package (GRASS GIS 2012). GRASS’ interface is not as user-friendly as other GIS software packages, e.g. Esri’s ArcGIS products, and it requires some fundamental knowledge about command line syntax to run some of the operations and to troubleshoot. For this case study, GRASS was used primarily for land use classification.
- ArcGIS is a commercial GIS software package developed by Esri, one of the world’s leading geospatial software companies. It is user-friendly and is particularly good for map development and visualization. ArcMap (one of the components of the ArcGIS package) was the main tool used for map generation and visualization.
- Quantum GIS (or “QGIS”) is another type of free open source GIS software that can perform basic data management operations and visualization. For this study, QGIS was used primarily for troubleshooting purposes and to perform basic functionalities when transitioning between GRASS and ArcMap.
Data Portals
Data portals are massive repositories of data that are made freely available online. In addition to making a vast amount of data available for download, many data portals provide visualization tools that can be used without working with the underlying data. The number and variety of data portals is continually increasing, providing free access to data in countless categories (e.g. environmental, economic, demographic), often on a global scale. Some of these data portals include the UNEP Environmental Data Explorer (UNEP 2014), The World Bank DataBank (The World Bank 2014), and the EU Data Portal (EU 2013).
A number of remote sensing-based data portals have emerged in recent years and new portals continue to emerge on a regular basis. The Giovanni web portal is a good example of this. The Giovanni web portal was developed by the Goddard Earth Sciences Data and Information Services Center of NASA (disc.sci.gsfc.nasa.gov/giovanni) and provides both visualization and download capabilities for a variety of global remote sensing data, including daily precipitation, air temperature, and soil evaporation, among a multitude of other parameters (NASA 2013a). This source of information is highly underutilized and is considered highly technical, despite its accessibility and simplicity.
Geographical Scope Description
This case study focuses on the Tsimlyansk Reservoir, which is located in Southern Russia, northeast of the Black Sea and the Azov Sea, as seen in Figure 2. It falls between two regions, called “oblasts”, Rostov to the west and Volgograd to the east. It is the largest freshwater body in the basin of the Azov Sea (Gilfanova 2012), measuring 260 kilometres in length and having a surface area of 2,702 square kilometres (Novikova et al. 2012). At full capacity, the volume of the reservoir is 23.9 cubic kilometres and it has a maximum depth of 36 meters (Lagutov and Lagutov 2012). The region itself is semi-arid and there is low precipitation in the entire basin and even less in the eastern areas, necessitating high amounts of freshwater abstraction from the reservoir for irrigation (Lagutov and Lagutov 2012).
Problem Description / Relevance to Water Security
The Tsimlyansk Reservoir in Southern Russia is of great environmental and economic importance to the region in which it is located. Formed as a result of the Tsimlyansk dam, the reservoir is relied upon for transportation, as a source of freshwater in an area that is densely populated, is used extensively for irrigation of the region’s agricultural lands, and is a source of cooling water for a nuclear power plant in the area, among a variety of other uses (Lagutov and Lagutov 2012).
The Don River, the largest river in the Azov Sea basin, is characterized by extreme variability in its annual water distribution. About 70% of the total river flow in the Don is comprised of snowmelt, causing tremendous discharge in the spring months as compared with the rest of the year. The Tsimlyansk dam was built to regulate this extreme variability. The main purpose of the dam was to allow for a reliable navigation route through the Don River and to secure access to the Volga-Don Shipping Canal, an important shipping canal linking the Don River and the Volga River and allowing access to the Caspian Sea (Lagutov and Lagutov 2012).
Furthermore, the region in which the reservoir is located, the Azov Sea basin, is a notably important economic region in both Russia and Ukraine. The basin encompasses a high level of agricultural development, including both cropland and livestock farming. The majority of the watershed is covered in cultivated lands. The region is known for its fertile soils and favourable climate, making it the “breadbasket” of Russia. But the region is semi-arid and there is low precipitation in the entire basin and even less in the eastern areas, necessitating high amounts of freshwater abstraction for irrigation (Lagutov and Lagutov 2012).
As such, water security is an important issue to consider in the basin. The Tsimlyansk Reservoir is the only freshwater source for many of the municipalities that surround it (Lagutov and Lagutov 2012). Approximately 457.5 thousand people depend on the freshwater it supplies (Shavrak et al. 2012). So many people in the region depend on these surface water bodies for drinking water, but availability is often variable and existing resources are becoming strained due to the variety of ecosystem services that depend on it.
But in recent years, harmful algal blooms have been reported and associated with a number of environmental and economic concerns. There are typically two peaks during the year of blue-green algae in the reservoir as a result of eutrophication, the first in the spring (Bacillariophyta) and the second in the late summer (Cyanophyta). The algae are highly productive and a bloom can reach up to 80% of the reservoir’s surface area (Nikanorov et al. 2012). Major fish kills have occurred in recent years, including one in 2010 in which approximately 900,000 fish were found dead in the reservoir. Similar instances of fish kills occurred in May 2007, June and August 2009 (Vesti 2011). In October 2009, a particularly bad algal bloom occurred, clogging filters at the water treatment plant and leaving about 170 thousand people without water for 3 days (Nikanorov et al. 2010). These major events were caused by algal blooms occurring as a result of increased eutrophication in the reservoir. Eutrophication is a major problem in the reservoir and there has not been adequate work done to address the issue in order to mitigate problems from future occurrences.
Agricultural runoff containing nitrogen and phosphorus is a well-recognized source of eutrophication in freshwater systems (Serediak et al. 2014; Ferreira et al. 2011). The Tsimlyansk Reservoir is in a region of high agricultural importance, deemed the nation’s “breadbasket” (Lagutov and Lagutov 2012). Because of the developed agriculture in the area, it is reasonable to assume there is a connection between the agricultural lands and the eutrophication events in the reservoir, but preliminary research must be conducted to determine if the agricultural lands in the region are indeed related to these events, which will set the foundation for how to address the problem on a higher level.
ICT Application / Outcome
The first step was to perform a land use classification to develop a land use land cover map to determine the extent to which agricultural lands cover the area of study. Four Landsat tiles (Figure 3), enough to cover the entire reservoir and adequate land around it, were obtained from the U.S. Geological Survey database (glovis.usgs.gov) for two dates, one at the beginning of the growing season (June-July) and one towards the end of the growing season (August) Images were selected based on the 1) time of year, 2) satellite mission, and 3) little cloud cover. A buffer zone of 50 miles was developed around the reservoir, based on the approximation that Phosphorus from agricultural runoff, one of the main nutrients associated with eutrophic algal blooms, can travel up to 50 miles (approximately 80 kilometres) from an agricultural field to a water body (American Farmland Trust 2013). A supervised classification was performed, a method that involves “training” analytical software to identify and differentiate between different land use types, and a land use thematic map was developed, as seen in Figure 4.
As seen in the land use map (Figure 4), the most dominant land cover is agricultural land, occupying approximately 57% of the area analyzed. Agricultural statistics from the Russian Federal Service of State Statistics (ROSSTAT 2010) were obtained and analyzed over a period of 15 years and it was determined that the proportion of agricultural lands to total land area has remained constant, thereby showing that land use in the region around the reservoir has stayed more or less the same: predominantly agricultural.
The next step was to identify eutrophication peaks, which was done using satellite imagery from the Landsat program, freely available on the U.S. Geological Survey database. Algal bloom events, which are easy to spot in a satellite image (See Figure 5), were identified within the same four tiles that had been selected for the land use classification, covering a period of 23 years. These instances were then compared with precipitation data for the region, thus investigating if there was a connection between episodes of high runoff and algal bloom events. Precipitation data was obtained from the Giovanni portal, discussed in the technology section.
In some years analyzed, there appears to be a clear relationship between precipitation (high runoff of agricultural residue containing eutrophication-causing compounds) and resulting algal blooms, as seen in Figure 6. After each spike of precipitation during the growing season, an algal bloom was identified shortly after. This pattern was identified in a few other years under study.
Applicability / Transferability
This case study is easily transferrable to other geographical areas. A variety of open source and freely available data portals and GIS software packages were used in this case, making the methods accessible and replicable.
Final Thoughts / Advantages & Disadvantages
While evidence of a potential relationship between the agricultural land surrounding the reservoir, episodes of high runoff as a result of high precipitation, and algal blooms was indeed seen in several instances under the period studied, the methods used do not allow for a conclusive outcome. The satellite imagery used to identify the algal bloom episodes was not representative of all of the algal blooms that occurred during the study period, due to the limited temporal availability of satellite imagery. Only blooms that occurred on 1) dates for which images were taken and 2) images in which an algal bloom could still be identified through atmospheric interference were identified. Years in which there were an absence of images does not necessarily indicate an absence of bloom activity. To address this, more remote sensing data sources could be investigated to find additional dates showing algal blooms. Additionally, other sources of information, like additional news articles, could be investigated to make the sample more representative of actuality. But this aside, the identified algal blooms do present a viable set of information that can be used as a basis for further research.
Furthermore, more can be investigated and combined with the existing findings to strengthen the existence of potential causal relationships (e.g. between precipitation and algal blooms, as was explored through this research) and to identify new relationships. Future research could include 1) investigating the role air temperature plays in the development of algal blooms; 2) obtaining data on the specific time, amount, and composition of fertilizer applications (ideally on a field-by-field basis); 3) combining both of these factors with the developed precipitation data to see what combination of factors causes blooms to occur (e.g. a few days of hot temperatures around the time of a fertilizer application, followed by a large precipitation event). Combining these and other environmental factors with the results obtained through this research could lead to further discoveries about the underlying causes of algal blooms and get closer to finding ways to mitigate the effects of future occurrences.
Additional Information / Acknowledgements
This case study was also based on a Central European University Master's Thesis entitled "Investigating potential agricultural-related causes of eutrophication in the Tsimlyansk Reservoir through GIS and remote sensing" by Emily Nilson, published May 2014 in Budapest. Sections have been reproduced here with permission of the author.
References
American Farmland Trust. 2013. Controlling nutrient runoff on farms.
Barnes, B. B., Hu, C., Holekamp, K. L., Blonski, S., Spiering, B. A., Palandro, D. and Lapointe, B. 2014. Use of Landsat data to track historical water quality changes in Florida Keys marine environments. Remote Sensing of Environment 140 (January): 485–96.
Brivio, P. A., Giardino, C. and Zilioli, E. 2001. Determination of chlorophyll concentration changes in Lake Garda using an image-based radiative transfer code for Landsat TM images. International Journal of Remote Sensing 22 (2): 487–502.
Chuvieco, E., and Huete, A. 2010. Fundamentals of satellite remote sensing. Boca Raton, FL, USA: CRC Press.
European Union (EU). 2013. “European Union Open Data Portal.” Accessed May 24. URL: http://open-data.europa.eu/en/data/.
Farag, H., and El-Gamal, A. 2011. Assessment of the eutrophic status of Lake Burullus. International Journal of Environmental Science and Engineering (IJESE) 2: 61–74.
Ferreira, J. G., Andersen, J. H., Borja, A., Bricker, S. B., Camp, J., Cardoso da Silva, M, Garcés, E., Heiskanen, A-S., Humborg, C., Ignatiades, L., Lancelot, C., Menesguen, A., Tett, P., Hoepffner, N., Claussen, U. 2011. Overview of eutrophication indicators to assess environmental status within the European Marine Strategy Framework Directive. Estuarine, Coastal and Shelf Science 93 (2): 117–31.
Gibson, P. J., and Power, C. H. 2000. Introductory Remote Sensing: Principles and Concepts. London; New York: Routledge.
Gilfanova, I. 2012. Application of SWAT modelling for assessment of ecosystem goods and services in the Azov Sea basin. Master of Science thesis, Central European University, Budapest.
GRASS GIS. 2012. "General Overview." GRASS GIS: The World’s Leading Free GIS Software. Accessed May 20. URL: http://grass.osgeo.org/documentation/general-overview/.
Kitsiou, D., and Karydis, M. 2011. Coastal marine eutrophication assessment: a review on data analysis. Environment International 37 (4): 778–801.
Kuemmerle, T., Radeloff, V. C., Perzanowski, K., and Hostert, P. 2006. Cross-border comparison of land cover and landscape pattern in Eastern Europe using a hybrid classification technique. Remote Sensing of Environment 103 (4): 449–64.
Lagutov, V., and Lagutov, V. 2012. The Azov ecosystem: resources and threats. In Environmental Security in Watersheds: The Sea of Azov, ed. V. Lagutov, 3–62. NATO Science for Peace and Security Series C: Environmental Security. Springer Netherlands.
NASA. 2013a. “Giovanni - Interactive Visualization and Analysis.” Goddard Earth Sciences Data and Information Services Center. Accessed May 12. URL: http://disc.sci. gsfc.nasa.gov/giovanni.
Nikanorov, A. M., Khoruzhaya, T. A., and Martysheva, N. A. 2012. Present-day characteristics and trends of long-term changes in ecological and toxicological conditions of the Tsimlyansk Reservoir. Russian Meteorology and Hydrology 37 (4): 269–75.
Nikanorov, A. M., Khoruzhaya, T. A., Minina, L. I., and Martysheva, N. A. 2010. Опасность «цветения» Цимлянского Водохранилища [Danger of ‘bloom’ Tsimlyansk Reservoir]. URL: http://zhurnal.ape.relarn.ru/articles/2010/012.pdf.
Novikova, N. M., Kalioujnaia, I. Y., Kalioujnaia, N. S., Sokhina, E. N., and Zubov, I. A. 2012. Identification and mapping of environmental conflicts for the Tsimlyansk water reservoir. Arid Ecosystems 2 (3): 156–64.
Ritchie, J. C., Zimba, P. V., and Everitt, J. H. 2003. Remote sensing technologies to assess water quality. Photogrammetric Engineering & Remote Sensing 69 (6): 695–704.
ROSSTAT. 2010. “Regions of Russia. Socio-economic Indicators.” Russian Federal Service of State Statistics, Moscow, Russia. Accessed May 18. URL: http://www.gks.ru.
Serediak, N. A., Prepas, E. E. and Putz, G. J. 2014. 11.8 - eutrophication of freshwater systems. In Treatise on Geochemistry (Second Edition), ed. H. D. Holland and K. K. Turekian, 305–23. Oxford: Elsevier.
Shavrak, E., Fesenko, L., Generalenko, and Ilyashenko, N. 2012. Multipurpose water scheme assessment of the Tsimlyansk Reservoir. In Environmental Security in Watersheds: The Sea of Azov, ed. V. Lagutov, 107–14. NATO Science for Peace and Security Series C: Environmental Security. Springer Netherlands.
The World Bank.2014. “World DataBank.” Accessed May 24. URL: http://databank. worldbank.org/data/home.aspx.
United Nations Environmental Programme (UNEP). 2014. “UNEP Environmental Data Explorer.” Accessed May 24. URL: http:// geodata.grid.unep.ch/.
United States Geological Survey (USGS). 2014. “USGS Global Visualization Viewer.” Accessed May 16. URL: http://glovis. usgs.gov/.
Vesti. 2011. Ситуацию с массовой гибелью рыбы в Цимлянском водохранилище проверила прокуратура [Situation with mass death of fish in the reservoir Tsimlyanskii checked prosecutors]. Вести [Vesti], Accessed May 15. URL: http://www.vesti.ru/doc.html?id=433156.
Weng, Q. 2013. Introduction to remote sensing systems, data, and applications. In Remote Sensing of Natural Resources, ed. G. Wang and Q. Weng, 3–23. Taylor & Francis Series in Remote Sensing Applications. Boca Raton, FL, USA: CRC Press.


