- Home
- Case Studies
- Geo-Spatial Data Modeling to Estimate Flood Affected Population in a Near Real-Time Scenario: Pakistan Floods 2011
Geo-Spatial Data Modeling to Estimate Flood Affected Population in a Near Real-Time Scenario: Pakistan Floods 2011
Author(s)
Organization(s)
Map
Technology Description
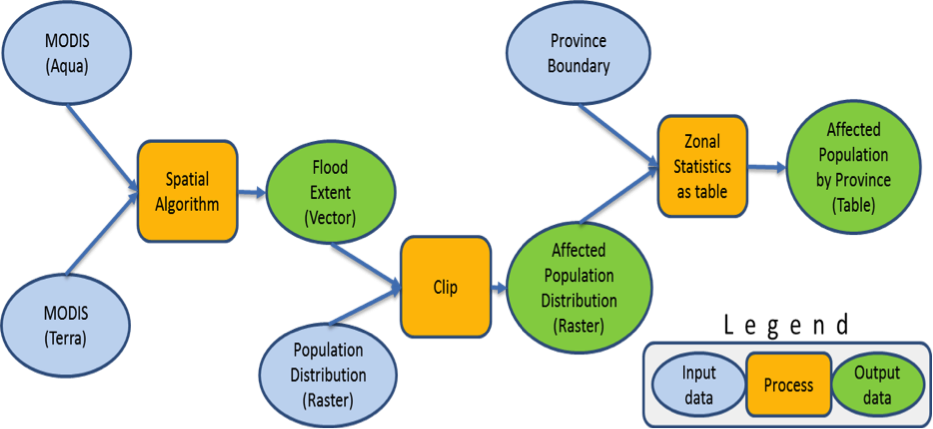
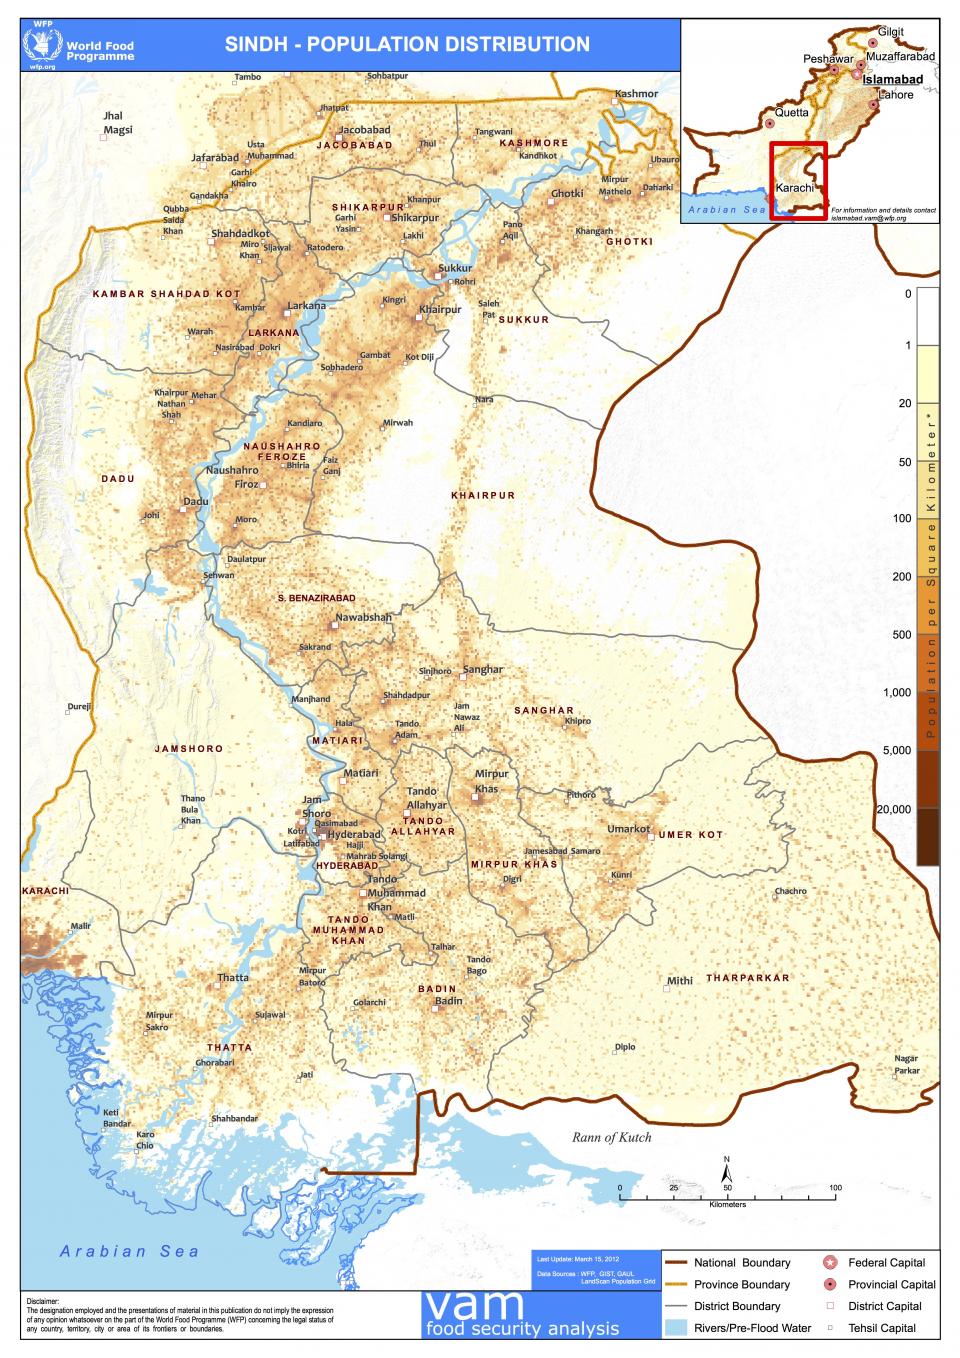
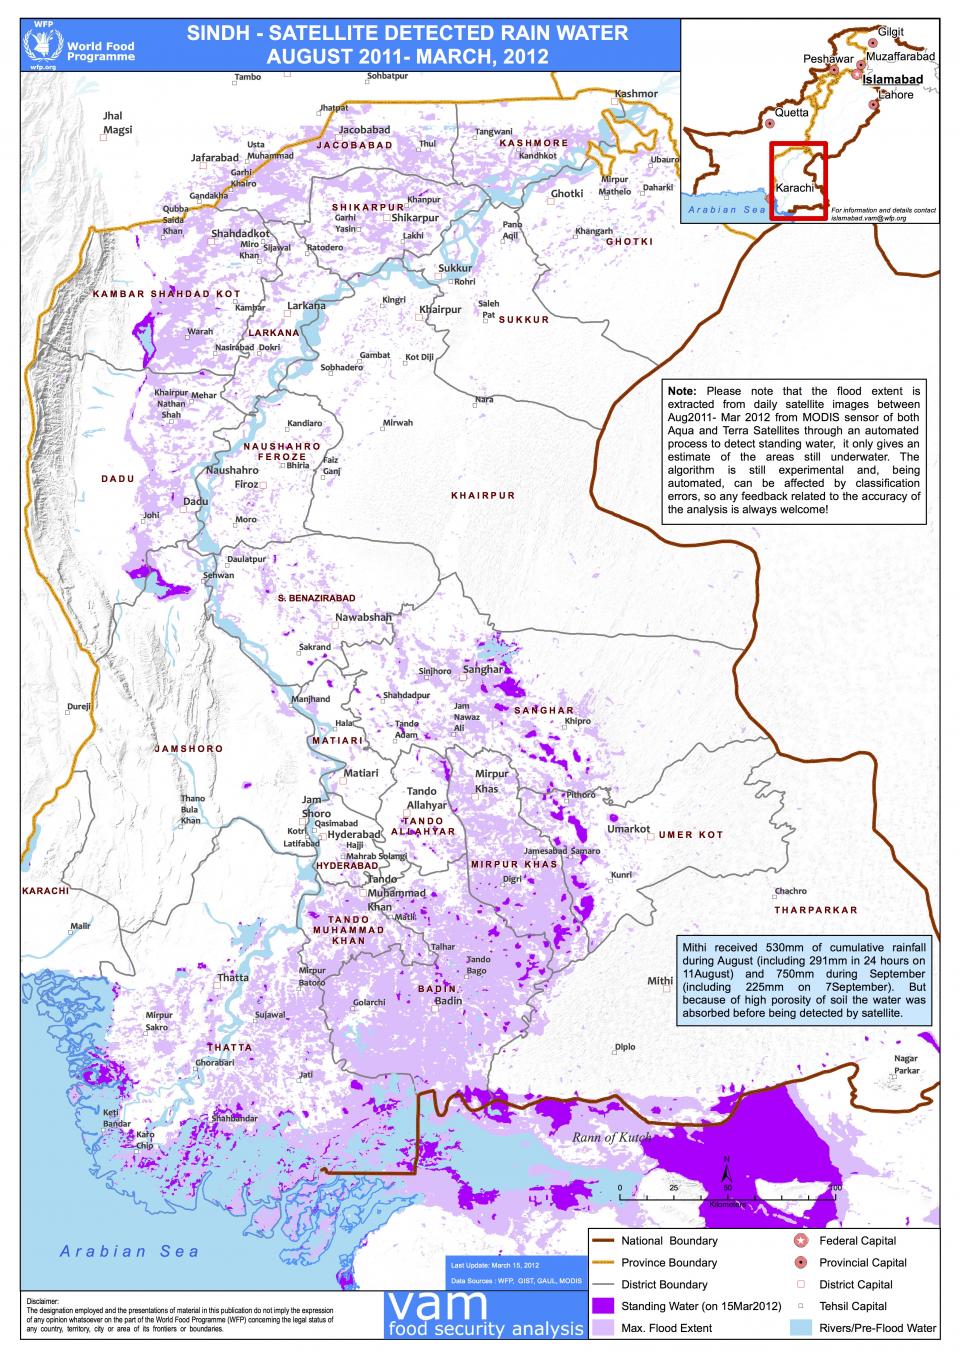
This methodology establishes the use of geo-spatial data analysis techniques in managing a disaster response. A geo-spatial data model estimates, on an almost daily basis, the population living in areas of standing flood water by using three freely available spatial datasets i.e. daily satellite images from MODerate resolution Imaging Spectro-radiometer (MODIS) sensors of Aqua and Terra Satellites, Updated LandScan population grid from Oak Ridge National Laboratory (ORNL) and administrative boundaries of Global Administrative Unit Layers (GAUL) of United Nations Food and Agriculture Organization (FAO) at admin level 1 (province level). Weather permitting, daily satellite images from MODIS were interpreted during monsoon flooding in Sindh province of Pakistan during August to October 2011, to get the daily as well as cumulative flooding extent in GIS format. The cumulative flood extent was then overlaid onto the population distribution grid to estimate the population living within areas of standing flood water. The regularity of updates helped in reflecting the evolution of emergency situation in a near real-time scenario.
Geographical Scope Description
Geographically, Pakistan lies between latitudes 24-37 degrees north and longitudes 62-75 degrees east covering a total land area of 796,095 sq km. The country shares borders with India in the East, Iran to the West, Afghanistan in the South-West and China in the North. The Arabian Sea lies to its South. Pakistan is a land of great topographic and climatic contrast. It is among the five South Asian countries with the highest annual average number of people physically exposed to floods which is primarily due to a weather system originate from Bay of Bengal during monsoon (July-September). After entering Pakistan from its east, it continues towards north into Kashmir. The mountain ranges in the extreme North of Pakistan provide a perennial source of inflow into the rivers. Floods particularly hit Punjab and Sindh while hill torrents tend to affect the hilly areas of Khyber Pakhtunkhwa, Balochistan, Gilgit Baltistan and Federally Administered Tribal Areas (FATA). The flood during 2010 was the worst in the recorded history of the country. During 2011, heavy monsoon resulted in the severe inundation of lower Sindh and eastern Balochistan provinces of Pakistan thereby affecting 9.5 million people. Alongside the exposure to people, the floods adversely affected major portions of cash crops in Sindh province with an estimated economic loss of USD 2.47 billion.
Problem Description / Relevance to Water Security
During humanitarian emergencies, Well-timed information on losses, affected areas and affected population is essential to plan any effective response and optimum resource allocation that are in hand. However, this is, conventionally, only available following an on-ground assessment.
The results of these assessments usually arrive too late to inform the first wave of the decision making process. Moreover, in order to align the response with the needs on ground, a continuous monitoring of the situation is required during an evolving crisis such as a flood, where the situation changes more frequently. However the information flow from the field is generally not efficient enough to allow for reporting at the desired frequency.
Timely information on areas affected and population affected can help in efficiently allocating the resources where needed most, minimizing the inefficiencies associated with poor management and decision making based on very little or sometimes no accurate information.
ICT Application / Outcome
A spatial model was developed for the assessment of the flood-affected population in a near real-time scenario using spatial analysis. A flood extent vector, extracted from MODIS daily images, was superimposed on a LandScan population grid to estimate the population count living in the flooded area, aggregated by their respective administrative level. The study aimed at introducing a simple, quick and cost efficient model for assessing the big numbers particularly around the identification of affected areas and affected population to respond the information needs during the first wave of decision making process of a flood response cycle using geo-spatial data modelling techniques and available datasets. The method proved to be both ‘time’- as well as – ‘cost-efficient’ for any flooding where water stays for a reasonable period of time and may be detected by a satellite image.
It has significantly facilitated the public sector as well as humanitarian organizations in responding an emergency and resource allocation by providing valuable information on affected areas and population regularly right from the onset of a flood emergency till the end of emergency response cycle. The model is practical in situations only where water remains in place for at least 24 hours so that it is possible for the extent of standing flood water to be detected by satellite. During monsoon season, cloud cover is the main problem, which can impede the analysis. Due to the medium to low resolution of the freely available spatial datasets (1km for population distribution and 250m for satellite data) used in this methodology, the model is not practical for micro planning until the data quality is improved spatially.
While detailed planning requires social indicators that can be best collected via field surveys and assessments, this model provides an initial, good estimate of populations living in areas of standing flood water which is critical to initial planning phase. In addition it allows for the swift allocation of resources immediately after the onset of any disaster. However, it does not replace the need for an in depth field assessment that would facilitate an analysis of the vulnerabilities of the affected population, including their food security and nutrition status.
The methodology was found to be both ‘time’ and ‘cost efficient’ for riverine floods. The model was tested for its accuracy using an on-ground initial vulnerability assessment and the figures matched to within 80-90%. This model can be used with a confidence level of ±10% for riverine floods.
Applicability / Transferability
Keeping in mind the field constraints and errors in administrative boundaries, this model can be used with a confidence of ±10% for riverine floods.
Final Thoughts / Advantages & Disadvantages
The method significantly facilitated the initial emergency response planning and resource allocation phase by providing an estimate of affected populations during the onset of a riverine flood and during its evolution.
The model is practical in situations only where water remains in place for at least 24 hours. During monsoon season cloud cover may be problematic which in turn can hamper the analysis. Due to the medium to low resolution of the spatial datasets (1km for population distribution and 250m for satellite data) used in this methodology, the model is not practical for micro level planning until the data quality is improved.
While detailed planning requires social indicators that can be best collected via field surveys, the model does provide a good estimate of populations living in areas of standing flood water which is critical to initial planning and allocation of resources immediately after the onset of a riverine flood.
The same model can also be used for assessment of inundated crops using updated land use data.
Additional Information / Acknowledgements
Excerpts from this case study have been published in the Journal of Flood Risk Management (Raza et al. 2014) and reproduced here with permission of the authors.
References
Ahmad, S. R., & V. Chris, L. (2009). Framework for a Spatio-Temporal Information-Based System (STIBS) for Decision Making. In Proceeding of the International Institute of Informatics and Systems. 2nd International Multi-Conference on Engineering and Technological Innovation. , 103-107.
Ahmed, Z. (2013). Disaster Risks and Disaster Management Policies and Practices in Pakistan: A Critical Analysis of Disaster Management Act 2010 of Pakistan. International Journal of Disaster Risk Reduction , 15-20.
Amarnath, G. (2013). An algorithm for rapid flood inundation mapping from optical data using a reflectance differencing technique. Journal of Flood Risk Management , early version.
Bhaduri, B., Bright, E., Coleman, P., & Dobson, J. (2002). LandScan. Geoinformatics , 34-37.
Dobson, J. E., Bright, E. A., Coleman, P. R., Durfee, R. C., & Worley, B. A. (2000). LandScan: a global population database for estimating populations at risk. Photogrammetric engineering and remote sensing , 849-857.
FFC. (2010). Annual Flood Report 2010. Federal Flood Commission, Ministry of Water and Power, Govt. of Pakistan.
Fouzili, L., Marzialetti, P., Laneve, G., & Santilli, G. (2013). Urban growth assessment around Winam Gulf of Kenya based on satellite imagery. Acta Astronautica , 279-290.
GAUL. (2009). Global Administrative Unit Layer. Retrieved October 16, 2012, from FAO Geo-Network: http://www.fao.org/geonetwork/srv/en/metadata.show?id=12691
Irimescu, A., Stancalie, G., Craciunescu, V., Flueraru, C., & Anderson, E. (2009). The use of remote sensing and GIS techniques in flood monitoring and damage assessment: A study case in Romania. In Threats to Global Water Security (pp. 167-177). Netherland: Springer.
Islam, A., Bala, S., & Haque, M. (2010). Flood inundation map of Bangladesh using MODIS time-series images. Journal of Flood Risk Management , 210-222.
Kameyama, S., Zhang, J., Wang, Q., XU, K., Katoh, T., & Watanabe, M. (2004). An approach to estimate the water level and volume of Dongting Lake using Terra/MODIS data. ACTA GEOGRAPHICA SINICA-CHINESE EDITION- , 88-94.
LandScan Data Availability. (2012, July 1). Retrieved January 28, 2014, from Oak Ridge National Laboratory: http://web.ornl.gov/sci/landscan/landscan_data_avail.shtml
MSDNA. (2011). Multi-Sector Damage Needs Assessment in Sindh and Balochistan Provinces. United Nations Pakistan and NDMA.
NDMA. (2010). Annual Report 2010. National Disaster Management Authority, Islamabad, Pakistan.
NRC. (2002). Down to Earth: Geographic Information For Sustainable Development,. National Research Council 2002,(National Academies Press).
PCO. (2012). Population Census Organization. Retrieved October 30, 2012, from http://www.census.gov.pk/aboutus.php
PIFA. (2011). Pakistan Initial Flood Assessment. Vulnerability Analysis and Mapping Unit of World Food Programme, OCHA and NDMA.
Rasmussen, B., Allen, S., Rasmussen, Z. A., & Bajwa, R. (2013). Learning from disasters to save lives every day in Pakistan. The Lancet , 2232–2234.
Raza, S.F., Ahsan, M.S. and Ahmad, S.R. (2014), Rapid assessment of a flood-affected population through a spatial data model. Journal of Flood Risk Management. doi: 10.1111/jfr3.12134
Raza, Fawad, Almas, Muhammad and Ahmed, Kamran. (2005) “Land Records Information Management System”. 25th Annual ESRI International User Conference, San Diego, California
Raza, S.F. Malik Z.I. (2012) “Use of GIS in Education related Decision Making and Strategy Planning”. 31st Annual ESRI International User Conference, San Diego,
RRP. (2011). Pakistan Floods: Rapid Response Plan. United Nations, Pakistan.
Tariq, M. a., & Giesen, N. v. (2012). Floods and flood management in Pakistan. Physics and Chemistry of the Earth , 11-20.
Voigt, S., Kemper, T., Riedlinger, T., Kiefl, R., Scholte, K., & Mehl, H. (2007). Satellite Image Analysis for Disaster and Crisis-Management Support. Geoscience and Remote Sensing, IEEE Transactions on , 1520 - 1528.
Weier, J. a. (2000, August 30). Measuring Vegetation (NDVI & EVI). Retrieved October 30, 2012, from NASA Earth Observatory: http://earthobservatory.nasa.gov/Features/MeasuringVegetation/measuring_...
WFP. (2015). About WFP. Retrieved April 08, 2015, from https://www.wfp.org/about


