- Home
- Case Studies
- Environmental Management Plan for the Lake Uromiyeh Ecosystem, Iran
Environmental Management Plan for the Lake Uromiyeh Ecosystem, Iran
Author(s)
Organization(s)
Map
Attachments
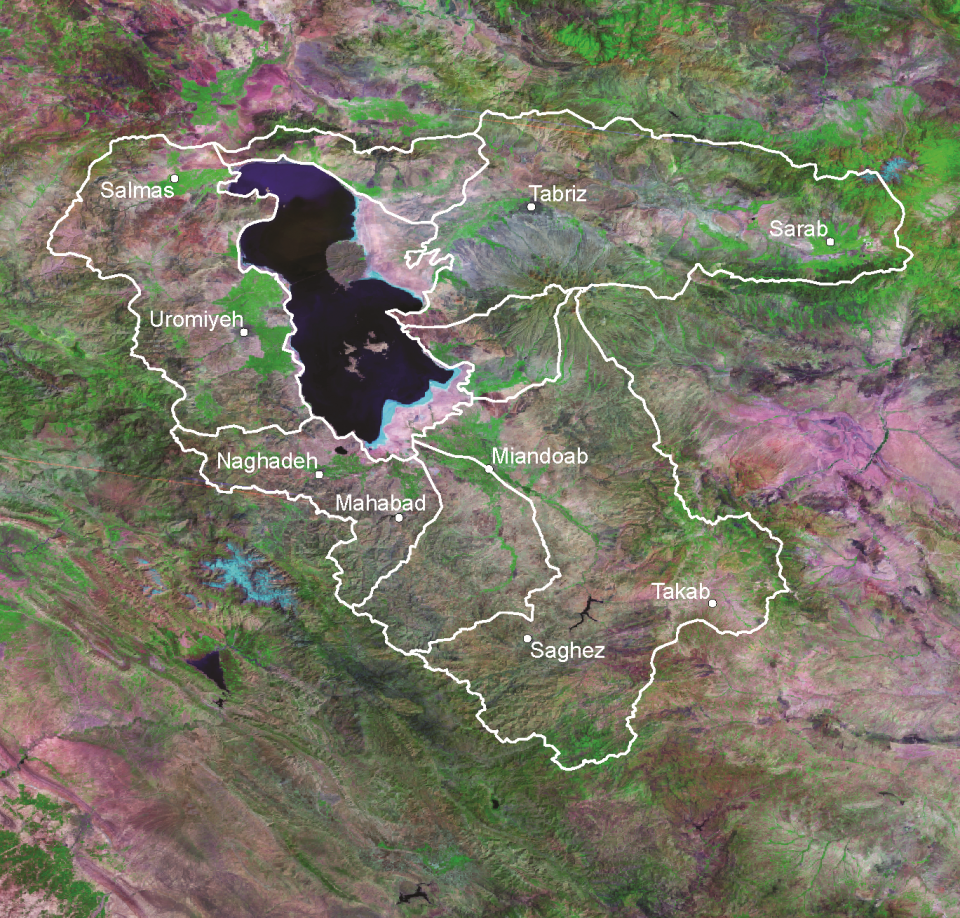
Figure 1. Lake Uromiyeh Basin with the major subcatchments
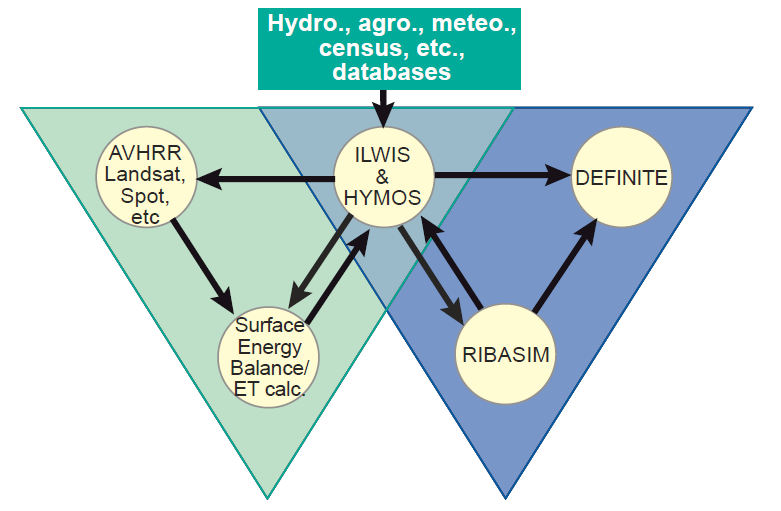
Figure 2. Logical framework of the integration of software tools in the decision support system
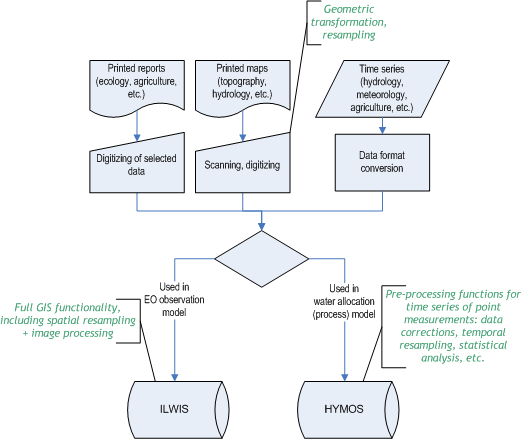
Figure 3. Data input to the central spatio-temporal database
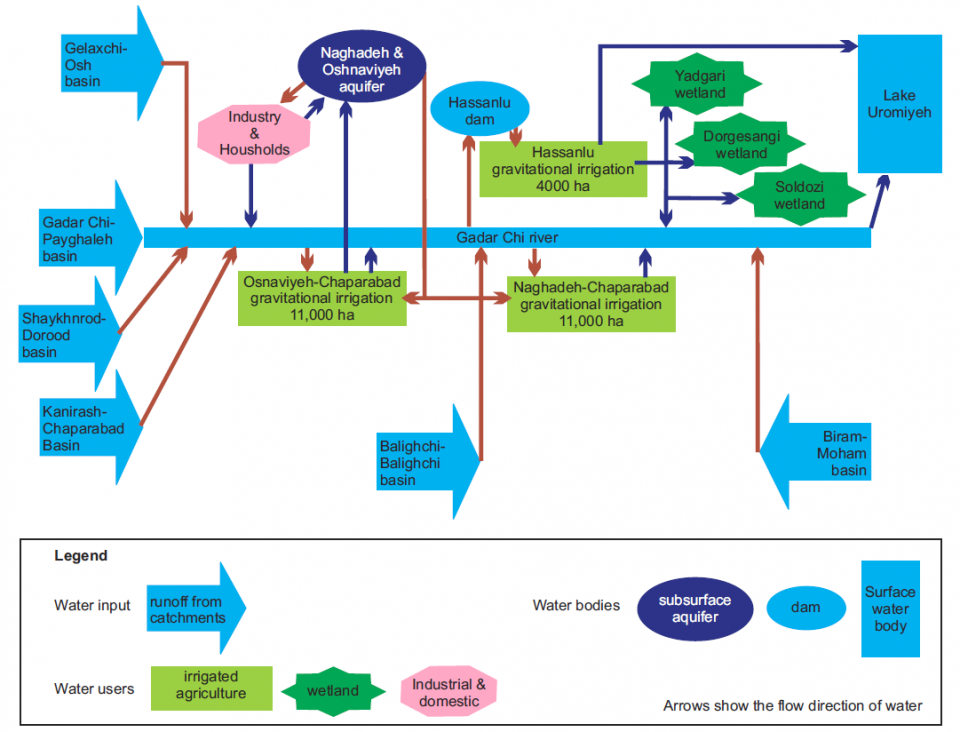
Figure 4. Schematic representation of water resources and users in the Ghadar Chai basin: recent situation
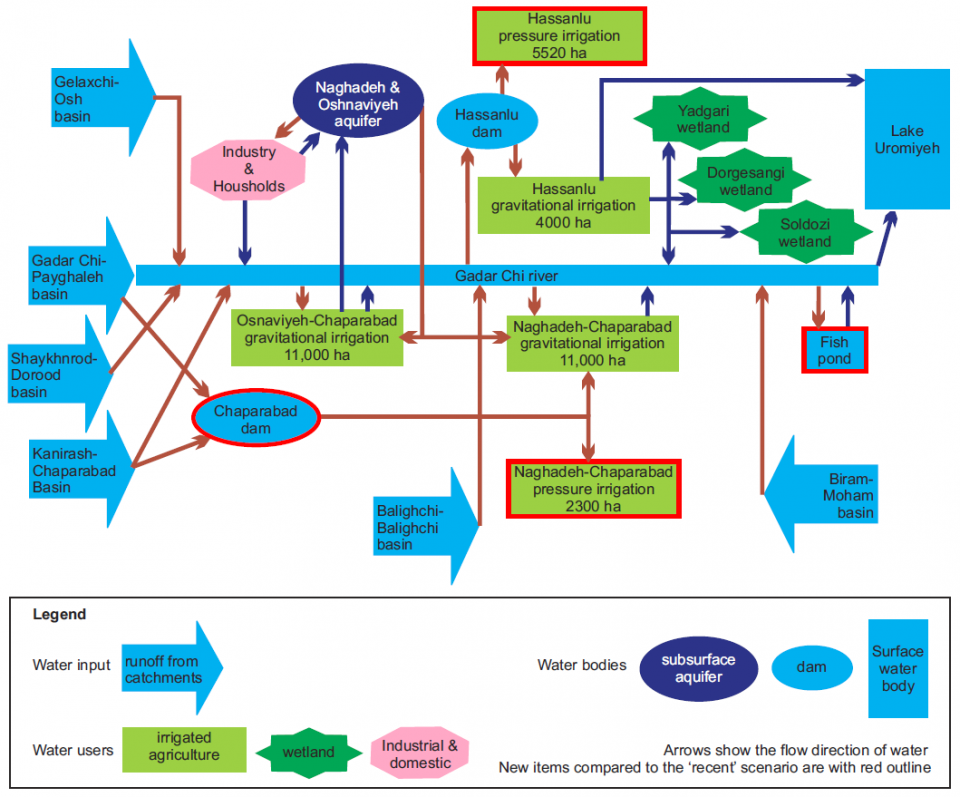
Figure 5. Schematic representation of water resources and users in the Ghadar Chai basin: future scenario with extended irrigation schemes
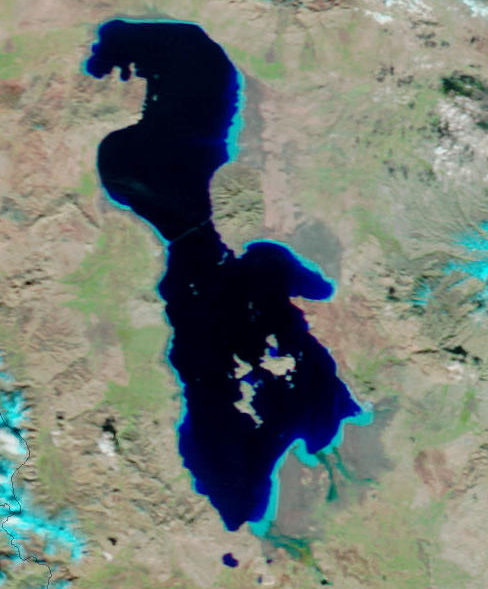
Figure 6a. MODIS images of Lake Uromiyeh: 30 Nov. 2005
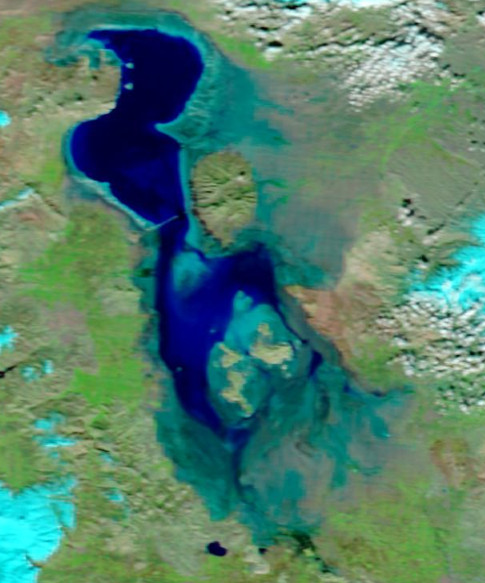
Figure 6b. MODIS images of Lake Uromiyeh: 23 Nov. 2014
Technology Description
For this case, different PC-based data storage, processing and analysis software tools were integrated for evaluating the water resources and how those can be used for serving the water demands of different users. A hydrological database, HYdrological MOdel System “HYMOS” (DELTARES, 2015a), contained the water management data. An important input to the system was remote sensing data for the evaluation of the spatial distribution of the actual evapotranspiration (using the Surface Energy BALance “SEBAL” algorithm, Bastiaanssen, Menenti, et al. 1998; Bastiaanssen, Pelgrum, et al. 1998) in the region in extreme hydrological conditions, i.e. in a wet and a dry year. A water allocation model (River BASin SIMulation “RIBASIM”, (DELTARES, 2015b)) was used to generate scenarios of different water policies. The resulting scenarios were then evaluated on the basis of effectiveness and suitability for a balanced water management with the DEcisions on a FINITE set of alternatives “DEFINITE” software (Free University of Amsterdam, 2015).
Geographical Scope Description
Lake Uromiyeh lies in the western part of Iran. Its basin covers about 54,000 km2, comprised of mountains and river flood plains (Figure 1). The climate is semi-arid, with an average annual rainfall of about 350 mm, with the low-lying areas (1200–1400 m above mean sea level) receiving about 250 mm / year and mountainous areas (around 3000 m above mean sea level) more than 1000 mm, mostly as snow. Irrigated agriculture is the main economic activity in the low-lying areas, exploiting both surface water and the groundwater resources, while rain-fed agriculture is practiced on the foot slopes of the mountains.
Problem Description / Relevance to Water Security
Lake Uromiyeh is shallow (6-8 m deep) and has no outflow, so all the precipitation falling in the basin evaporates either from the land or from the lake itself. The evaporating water leaves the dissolved salts behind. The actual salinity depends on the amount of water in the lake, i.e. the lake level. These circumstances led to the development of a relatively simple ecology, populated by salt-loving organisms at each level of the food chain.
Falling lake levels since 2000 caused the shoreline to retreat, leaving behind a desert of salt and resulting in the complete collapse of the lake’s flora and fauna. The decline of water resources is also expressed in the drop of groundwater tables around the lake. These events presented the authorities with a warning that better coordination of water use – involving all stakeholders around the lake – is needed.
A PC-based decision support tool was developed in a cooperation project between the Netherlands and Iran in the second half of the previous decade. It provides a software framework for analyzing the water resources and the actual distribution of the water among the users.
ICT Application / Outcome
The principles of integrated water management were applied. The key tool in it was a decision support system (DSS) that combined data from all related fields.
The advantage of using a DSS in integrated water resources management is that it provides the possibility of testing outcomes of different water allocation schemes, i.e. of different scenarios.
The DSS for Lake Uromiyeh incorporated several software tools, comprising four major logical units (Figure 2).
- External databases (green rectangle in Figure 2), not an integral part of the system;
- A central spatio-temporal database, a loose amalgamation of a Geographic Information System (GIS) / Remote Sensing (RS) Integrated Land and Water Information System “ILWIS” and a hydrological database software (HYMOS);
- Earth Observation (EO) data and observation models (the left side of the figure), which were used independently from the rest of the DSS. In fact, this part processes the input data for the decision support part of the system;
- Loosely coupled process models, which were exchanging data in off-line mode.
A well-defined data flow was established between the logical units of the DSS.
Hydrological, agronomic, meteorological, statistical, ecological and topographic data were merged into the central database. In many cases, some conversions were made to fit the import requirements of the data storage systems both in file formats as in data structure.
The functions of the central database concentrated on storing the data in a practical structure: data for the process models were integrated into the hydrological data management environment (HYMOS), whilst the data needed for the EO observation models were stored in the analysis-oriented GIS (ILWIS), see Figure 3.
The most frequently used spatial data processing types were the following:
- Re-projection of maps;
- Spatial re-sampling for adjusting spatial resolution;
- Re-sampling of coarse resolution to smaller grid size; densification;
- Re-sampling of finer resolution to coarser grid size; aggregation;
- Spatial interpolation of irregularly spaced point data. Simple and complex interpolators were included.
Earth observation formed an integral part of the data analysis. Two major analysis types were based on Earth observation data:
- Satellite images were used for mapping the land cover and defining the major water users from this map (e.g. irrigated and rain-fed agriculture). The intermediate results were stored in the central spatio-temporal database (not shown in the figure);
- A surface energy balance method (SEBAL, (Bastiaanssen, Menenti, et al. 1998; Bastiaanssen, Pelgrum, et al. 1998)) was used for mapping the distribution of the basin-leaving water flux, i.e. the evapotranspiration (ET).
The outputs of the two analysis were used for defining the water demands of the different users in a wet (1993-1994) and a dry (1999-2000) hydrological year. This result was stored then in the HYMOS database.
Allocation of water for the different users’ needs a careful evaluation of the available water resources versus the water demands and distribution priorities. The process modelling part of the DSS comprised of two models:
- The RIBASIM (RIver BAsin SIMulation, developed by Delft Hydraulics, (DELTARES, 2015b)), which distributes the available water resources to the users according to distribution priorities and needs. It is able to simulate the flow of water from the headwaters of rivers to the lowest point of the basin; in our case from the mountains to Lake Uromiyeh. Water is traced through river channels, lakes, reservoirs, wetlands as well as groundwater flow from the sources to the users. The logical structure of the recent situation in a sub-basin (the Ghadar Chai basin) is shown in Figure 4.
Not only the recent situation, but future scenarios can also be simulated with RIBASIM. An example is shown in Figure 5, including new irrigation schemes. In this scenario, four new irrigation schemes, a new dam and a new fish pond are included.
- DEFNITE (DEcisions on a FINITE Set of Alternatives, (Free University of Amsterdam 2015)) is a tool for impact assessment and scenario analysis. A wide range of decision support tools are included in it, e.g. multicriteria methods, as well as cost-benefit and cost-effectiveness analysis tools. It can compare, e.g. the different output scenarios from RIBASIM by assigning weights and can assess the most reasonable option. In this sense, DEFINITE is not a process model, but a tool to characterise and analyse the results of a process model.
Different scenarios were calculated with different priorities and different levels of irrigation development. Unfortunately, the DSS proved that the recent water use is already not sustainable. This result poses and enormous challenge to the water managers of the region, especially that social and economic pressure still increases the water demand.
Applicability / Transferability
This case study demonstrates of the use of different information technology tools, from database management through geo-information processing to process modelling and analysis in a water management framework. Generic tools (e.g. software packages) were assembled for a concrete purpose with site-specific data. Similar approach can be used on any other geographic areas if data is available. But tools remain only tools, if no sufficient decisions and action are taken on the basis of the results provided by these tools.
Final Thoughts / Advantages & Disadvantages
Data of different kinds, obtained from several sources were integrated in the decision support system developed for the formulation of the Lake Uromiyeh Environmental Management Plan. The complexity of the problem required different methods of spatial and temporal resampling to create a data set that fits the analysis methods. Statistical and deterministic observation models were used to calculate the input data to a process model, which provided water allocation scenarios in all the sub-catchments of the Lake Uromiyeh Basin.
It is important to underline, that the DSS only supports decisions, and does not make decisions. The modelling results proved that there is a need for working out new management plans, which can make the demands and the available resources match in a sustainable manner. Unfortunately, as time flies, in reality, the plans remain mostly plans, and due to practical reasons, the overuse of the water resources could not be stopped. The first management plan was developed around 2006, and further efforts were put in implementing integrated water management methods for slowing down the fall of the lake level. Results are less than modest, as shown in Figure 6a and Figure 6b.
Additional Information / Acknowledgements
This case study follows the description published in (Tolpekin & Stein (eds.) 2012).
References
Bastiaanssen, W. G. M., Menenti, M., Feddes, R. A., & Holtslag, A. A. M. (1998). A remote sensing surface energy balance algorithm for land (SEBAL). 1. Formulation. Journal of Hydrology, 212-213(1-4), 198–212. Retrieved from D:\irodalom\Reference library\ET\1998 SEBAL_1 Formulation.pdf
Bastiaanssen, W. G. M., Pelgrum, H., Wang, J., Ma, Y., Moreno, J. F., Roerink, G. J., & van der Wal, T. (1998). A remote sensing surface energy balance algorithm for land (SEBAL): 2. Validation. Journal of Hydrology, 212-213(1-4), 213–229. Retrieved from D:\irodalom\Reference library\ET\1998 SEBAL_2 Validation.pdf
DELTARES. (2015a). HYMOS. Retrieved July 1, 2015, from https://publicwiki.deltares.nl/display/HYMOS/Home
DELTARES. (2015b). RIBASIM. Retrieved July 1, 2015, from https://www.deltares.nl/en/software/ribasim/
Free University of Amsterdam. (2015). DEFINITE. Retrieved July 1, 2015, from http://www.feweb.vu.nl/gis/research/?ResearchID=301&MenuStat=5
Tolpekin, V., Stein, A., & (eds.). (2012). The core of GIScience: a system-based approach. Enschede, the Netherlands: International Institute for Geo-information Science & Earth Observation (ITC).


