- Home
- Case Studies
- Airborne Laser Scanning and Aerial Hyperspectral Imaging Technologies in Disaster Management: Hungary, Kolontár Red-Mud Spill
Airborne Laser Scanning and Aerial Hyperspectral Imaging Technologies in Disaster Management: Hungary, Kolontár Red-Mud Spill
Author(s)
Organization(s)
Map
Attachments
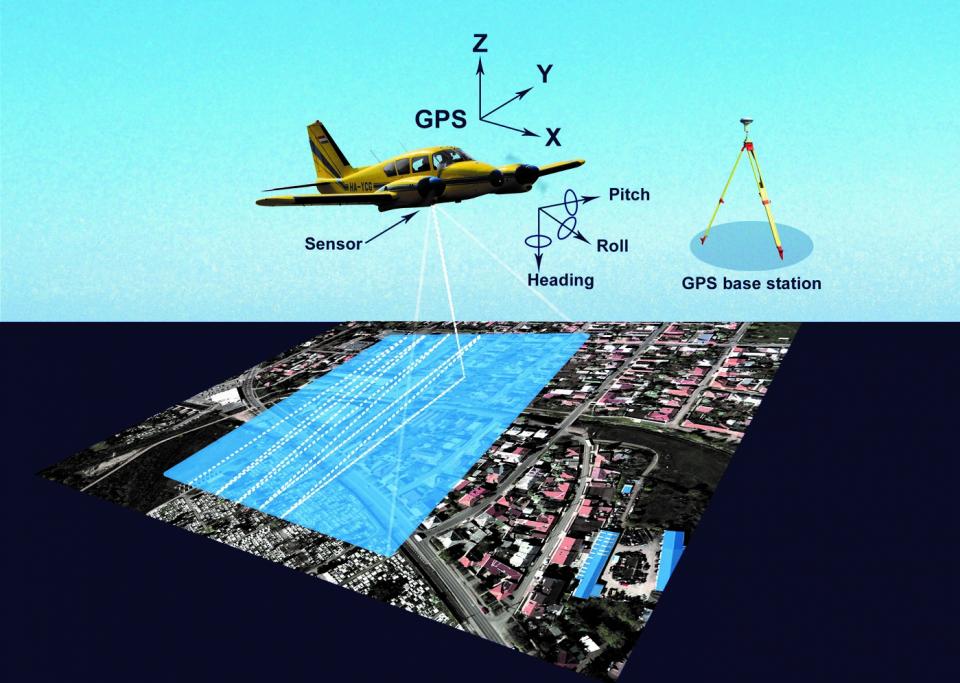
Figure 1. Operation of airborne LIDAR technology
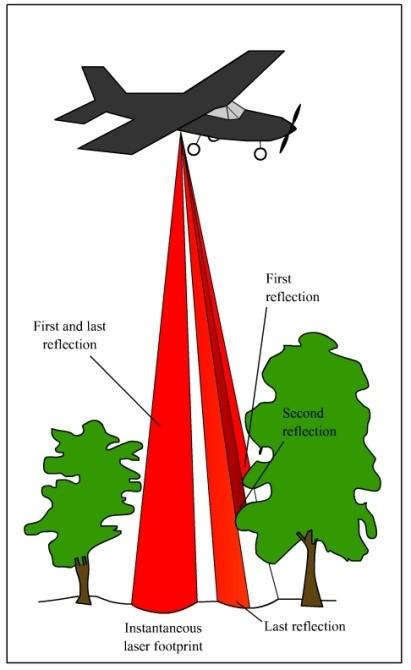
Figure 2. LIDAR laser returns
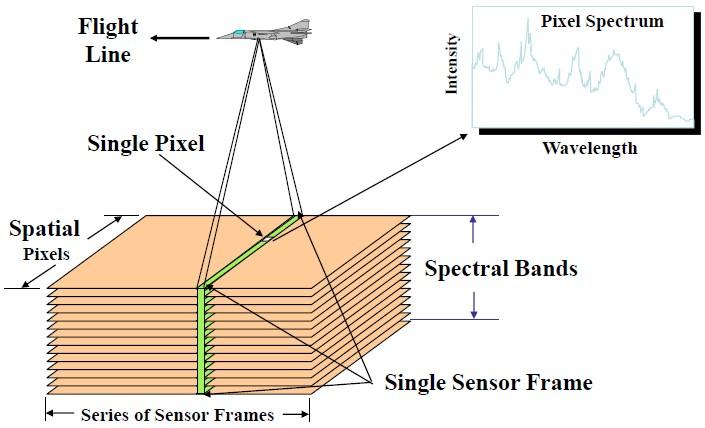
Figure 3. Operation of aerial hyperspectral imagery
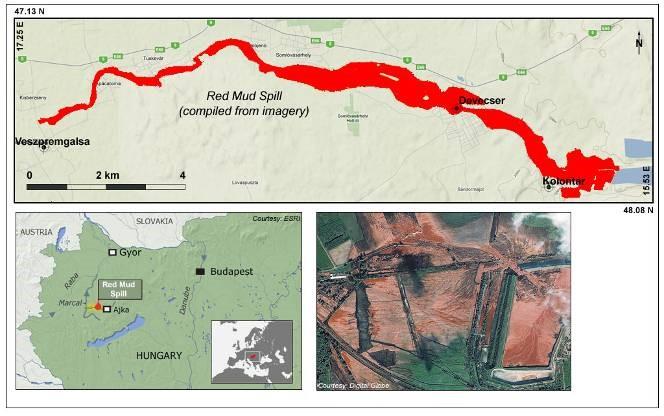
Figure 4. Location area and approximate direction of red-mud spill
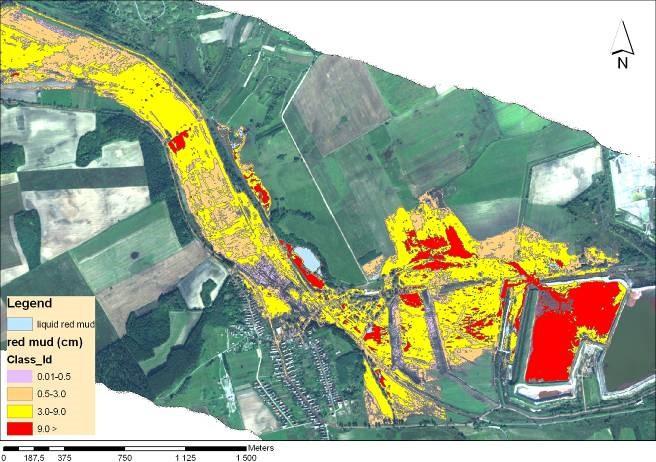
Figure 5. Estimated depth of red mud as a function of RMLI.
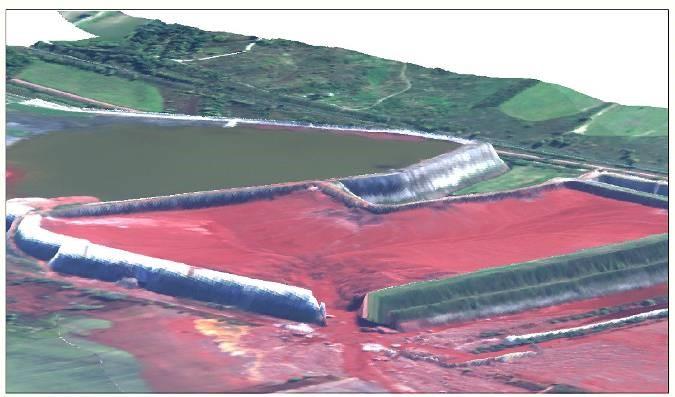
Figure 6. Integrated LIDAR and HSI data over ruptured containment dam.
Technology Description
To measure and investigate a complex disaster event airborne laser scanning (LIDAR), aerial hyperspectral imagery and thermal and near infrared imagery have been used. In this case study only the two main technologies and survey methods are introduced due to page limit.
Airborne laser scanning (LIDAR)
LIDAR is an optical remote-sensing technique that uses laser light to scan the surface of the earth, producing highly accurate spatial data (Figure 1). LIDAR, primarily used in airborne laser mapping applications, is emerging as a cost-effective alternative to traditional surveying techniques such as photogrammetry. The major hardware components of a LIDAR system include a collection vehicle (aircraft, helicopter, vehicle, and tripod), laser scanner system, GPS (Global Positioning System), and INS (inertial navigation system). An INS system measures roll, pitch, and heading of the LIDAR system.
LIDAR is an active optical sensor that transmits laser beams toward a target while moving through specific survey routes. The reflection of the laser beam is detected and analyzed by receivers in the LIDAR sensor.
Laser pulses emitted from a LIDAR system reflect from objects both on and above the ground surface: vegetation, buildings, bridges, and so on (Figure 2).
Aerial hyperspectral imagery
The aim of aerial hyperspectral imagery is to collect data with high information content and field resolution about our environment. Therefore one such image may be suitable for determining material or biophysical properties that would not be possible using traditional aerial imagery. This is due to the fact that a hyperspectral sensor collects data in a much wider wavelength band, so it includes ranges invisible to the human eye (Figure 3).
Until recently hyperspectral applications stayed within the limits of research, nevertheless nowadays more and more practical uses of aerial hyperspectral imagery appear in the field of botany, agriculture, environmental protection, military, disaster management and other fields requiring detailed environmental data.
Geographical Scope Description
The discussed disaster event happened in the Devecser Subregion, Northwestern Hungary. The most affected settlements were Devecser and Kolontár. To understand the characteristics of the disaster it is important to introduce the main geographical factor, the water resource specificities of the area. The affected area has very dense surface and ground water resources and it is located in the catchment of the Torna-stream in which is a part of the River Marcal catchment. Upstream from the River Marcal, Torna-stream collects smaller surface streams through a 50.8 km long valley. The whole catchment area is 498 km2. The River Marcal with many tributaries discharges into the River Rába which then discharges into the River Mosoni-Danube and eventually to the River Danube. In addition, the pollution occurred in a sensitive area with vulnerable ground water resources (Terport).
Problem Description / Relevance to Water Security
On October 4, 2010 the embankment of the red mud reservoir failed and released a mixture of 600-700 thousand cubic meters of red mud and water. The mud, a byproduct of refining aluminium from bauxite ore, was dangerously alkaline, extremely salty and contained potentially toxic metals like chromium and vanadium. Lower parts of the settlements of Kolontár, Devecser and Somlóvásárhely villages were flooded. Ten people died, and another 120 people were injured. The red mud flooded 800 hectares of surrounding areas. The most severe devastation was caused in the villages of Devecser and Kolontár, which are located near the reservoir. The disaster belongs to the worst environmental catastrophes in Hungarian history which risked the whole area’s water resources, water courses, rivers, population and wildlife.
ICT Application / Outcome
Survey and analysis of the effects of red mud disaster-prone area and information service for authorities:
The primary mission objective of the data collection was monitoring needed to estimate environmental damage, the precise size of the polluted area, the rating of substance concentration in the mud, and the overall condition of the flooded district. The secondary objective was aimed to provide geodetic data necessary for the high-resolution visual information from the data obtained with a LIDAR survey, and for coherent modelling of the event. For quick assessment and remediation purposes, it was deemed important to estimate the thickness of the red mud, particularly the areas where the depths of the layer were more than 3cm.
Data collection used five different remote sensing systems and intended to streamline and combine the processing of different technologies and collected data for both short-term and long-term purposes.
The approximate size of the affected area was estimated at about 1,000 hectares on the basis of information derived from the high-resolution satellite data and airborne imagery. Quantitative and qualitative information were derived from radiometric and geometric corrected hyperspectral images.
Red Mud Layer Indices (RMLI) were calculated from hyperspectral bands (549nm, 682nm) (Burai et al. 2011) to describe depth of red mud layer in the affected area (Figure 5). The indices are essentially a modification of a Hydrocarbon Index (Hörig et al. 2001) and NDVI index, both of which are applicable in dealing with distinctive absorption patters in the visible-near infrared range.
In this project, the LIDAR data were primarily used to create a high resolution, 3-D topographic model of the ruptured containment pond wall and examine it for the possibility of continued rupture along the western and northern walls. The LIDAR data were gridded to produce a high-concentration point-cloud density that was then draped over with high resolution imagery from the Hyperspectral imagery. The combined analysis had shown propagation of collapsed features (compromised structure) along the western retention wall and the areas have been subsequently stabilized (Figure 6) (Lenart et al. 2011).
Results from LIDAR and aerial hyperspectral imagery:
- Red mud spill map;
- Digital Terrain Model (DTM);
- Digital Surface Model (DSM);
- Quantitative direction of spilled red mud.
Applicability / Transferability
In this case study, the presented measurement methods and technologies could successfully be adapted to survey and investigate other similar disaster events, and to support disaster management-related decision making methods. The applied aerial and ground based technologies and devices are not site-, territory- or country-specific thus these can be adapted to almost any location or industrial area. In addition, the know-how for the data processing and classifying exists and is continuously improving.
Final Thoughts / Advantages & Disadvantages
These applied technologies and their results achieved the expected goals of the project, thus disaster management professionals could use the resulting data sets, maps and models in disaster- and remediation-related decision making methods and practice alike.
Advantages of the applied technologies: fast and highly accurate data collection from the affected area, collecting high precision data, successful decision support, implemented precise and accurate data service for the mitigation and remediation of red mud spill affected area and the determination of inundated red mud amount
Disadvantages of the applied technologies: sudden, high resource demand and very specific expertise required.
References
Burai, P., Smailbegovic, A., Lénárt, Cs., Berke, J., Tomor, T., Bíró, T., (2011): Preliminary analysis of red mud spill based on aerial imagery. Acta Geographica Debrecina, Landscape & Environment Series, Volume 5, I: 1-12.
Hörig, B., Kühn, F., Oschütz, F., Lehmann, F. (2001): HyMap hyperspectral remote sensing to detect hydrocarbons, International Journal of Remote Sensing, 22:8, 1413-1422
Lenart, Cs. Burai, P. Smailbegovic, A. Biro, T. Katona, Zs. Andricevic, R. (2011): Multi-sensor integration and mapping strategies for the detection and remediation of the red mud spill in Kolontar, Hungary: Estimating the thickness of the spill layer using hyperspectral imaging and LIDAR. Hyperspectral Image and Signal Processing: Evolution in Remote Sensing (WHISPERS), 2011 3rd Workshop. Lisbon, 6-9 June 2011. ISSN :2158-6268, Print ISBN: 978-1-4577-2202-8
"Terport" is a free and publicly open internet service of the National Information System for Rural Development and Spatial Planning (TeIR) operated by Lechner Knowledge Centre nonprofit Ltd. In "Terport" analyses, strategies and development documents (regarding regional development, spatial planning and rural development) can be accessed for all levels (European, national, regional, county, sub-regional and local). This case used the "Urban Development Strategy of Devecser" that is accessible in Terport, but only in Hungarian language.


